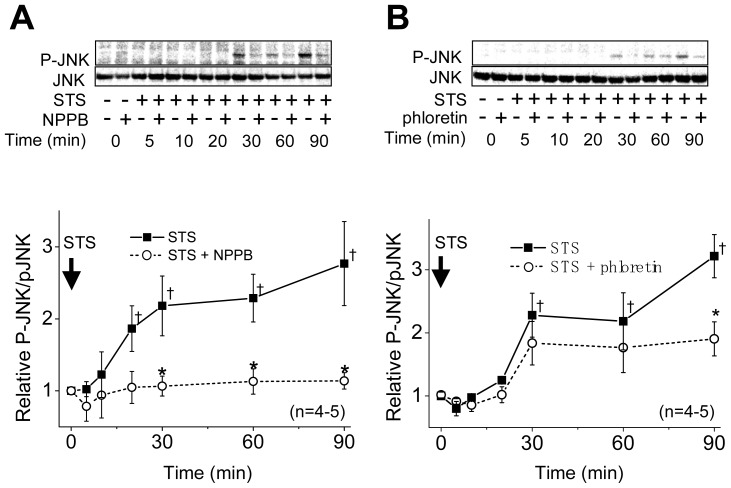
Figure 3.
Sensitivity of STS-induced phosphorylation of JNK to a VSOR blocker, NPPB or phloretin, in HeLa cells. Top panels: Western blot analysis for time-dependent changes in the levels of phosphorylated JNK (P-JNK) and non-phosphorylated JNK (JNK) in the absence (−) or presence (+) of 200 μM NPPB (A) or 100 μM phloretin (B) without or with STS (4 μM) stimulation. Bottom panels: Time course of the ratio of P-JNK to JNK after STS stimulation in the absence (filled squares) or presence (open circles) of 200 μM NPPB (A) or 100 μM phloretin (B). Each symbol represents the relative mean value (normalized by the mean value at time zero) with SEM (vertical bar) (n = 4–5). * p < 0.05 versus the data in the absence of a VSOR blocker at a given time. † p < 0.05 between the data in the absence of a VSOR blocker at time zero and at a given time.

