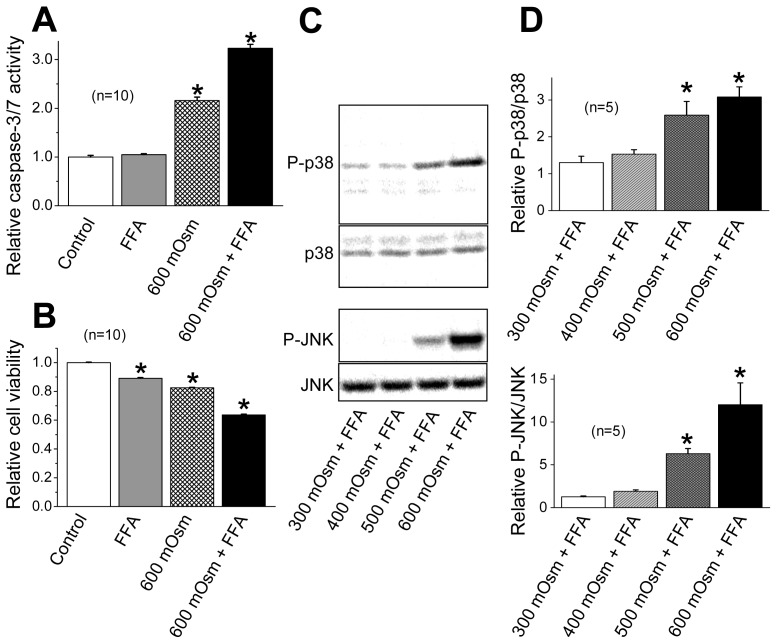
Figure 6.
Effects of sustained osmotic shrinkage on caspase activity, cell death and MAPK phosphorylation in HeLa cells. (A, B) Caspase-3/7 activity and cell viability before (Control: open column) or after treatment with 100 μM FFA alone (shadowed column), 600 mOsmol/kg-H2O (mOsm) hypertonic solution (hatched column) or the hypertonic solution supplemented with 100 μM FFA (filled column) for 4 h (A) or 2 days (B). Each column represents the relative mean value (normalized by the control value) with SEM (vertical bar) (n = 10). * p < 0.05 versus Control. (C) Western blot analysis for osmolarity-dependent changes in the levels of P-p38 and P-JNK after incubation in isotonic (300 mOsm) or hypertonic (400, 500 or 600 mOsm) solution containing 100 μM FFA. (D) Ratios of P-p38 to p38 (top panel) and P-JNK to JNK (bottom panel) after incubation in 300, 400, 500 or 600 mOsm solution containing 100 μM FFA for 30 min. Each symbol represents the relative mean value (normalized by the control value at 300 mOsm in the absence of FFA) with SEM (vertical bar) (n = 3). * p < 0.05 versus the data for 300 mOsm + FFA.

