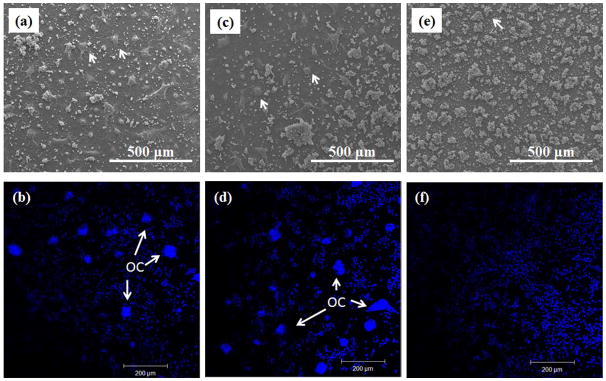
Figure 6.
FESEM micrographs of osteoclast-like cells on (a) TCP, (b) Sr-TCP and (c) Mg-TCP samples after 8 days of culture. (d), (e) and (f) represents fluorescence microscopy images of cells attached to TCP, Sr-TCP and Mg-TCP respectively. Blue represents the nucleolus. White arrows indicate osteoclast-like cells.

