
Figure 6.
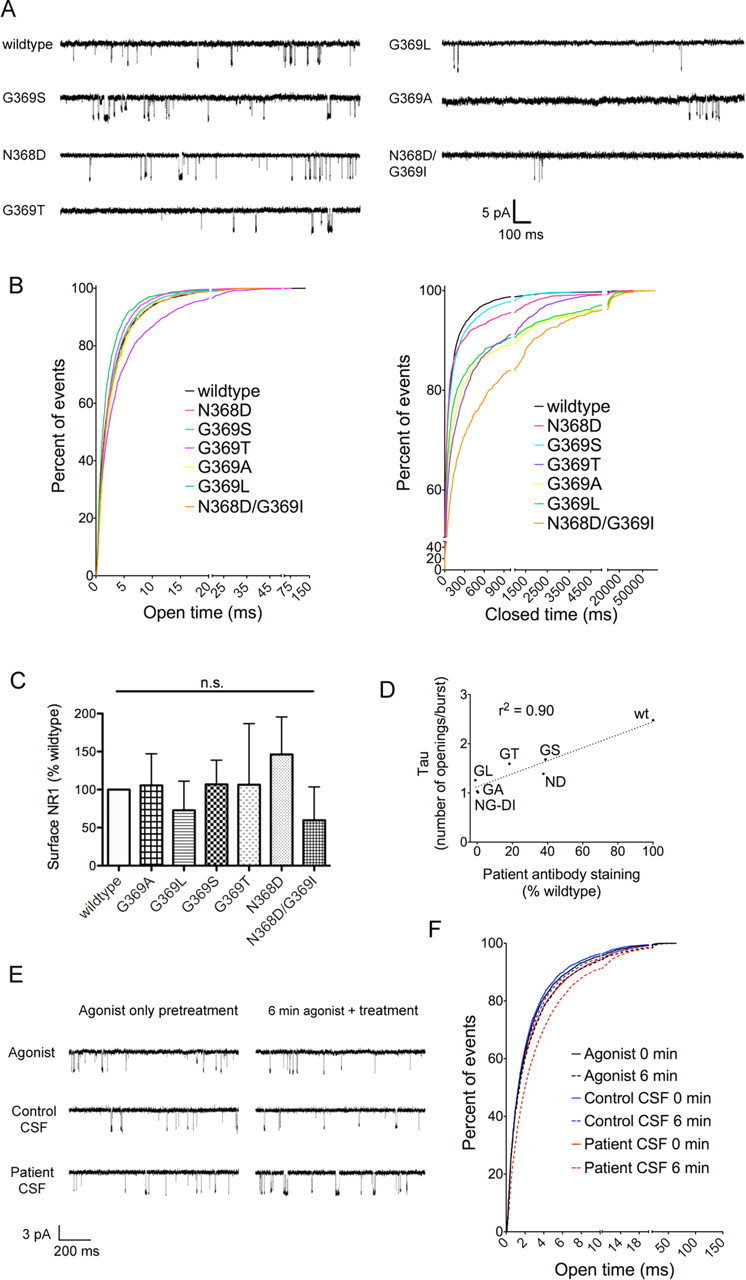
GluN1–N368/G369 mutations affect receptor closed duration but not surface expression, and antibody application prolongs open time. A, Example single-channel outside-out traces from GluN1 mutants, coexpressed with GluN2B in HEK293 cells. All traces were recorded with coapplication of 100 nm glutamate and 1 μm glycine. B, Cumulative frequency histograms of open duration and closed duration of single-channel traces (n = 4–5 patches per mutant). C, Cell-surface biotinylations show no difference in surface expression of GluN1, normalized to transfection efficiency (lysate GFP levels) and a surface loading control (transferrin receptor) (n = 3, p > 0.05, one-way ANOVA). D, The number of events in a burst correlates with patient antibody staining of N368/G369 mutants, as measured by the tau of the exponential fit of event number histogram (r2 = 0.90, linear regression; n (single channel burst analysis) = 4–5 patches, n (staining) = 8–11 patients). E, Example single-channel outside-out traces from GluN1/GluN2B-transfected HEK293 cells exposed to a minimum of 2 min 100 nm glutamate/1 μm glycine (agonist only pretreatment) followed by a minimum of 7 min agonist only, agonist with control CSF (1:100), or agonist with patient CSF (1:100) (6 min agonist plus treatment). F, Cumulative frequency histograms of open duration (n = 7–8 patches per condition). 0 min = open duration during 1 min of recordings in agonist immediately preceding treatment; 6 min = open duration during 1 min of recordings in agonist only, agonist + control CSF (1:100, 2 individuals), or agonist + patient CSF (1:100, 3 individuals), measured after 6–7 min of treatment.