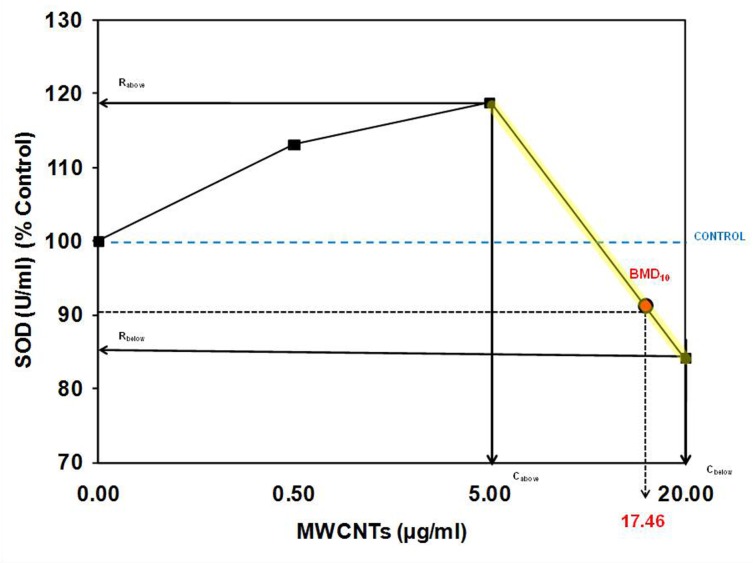
FIGURE 3.
Distribution of responses at concentrations below the estimated toxic threshold (BMD10). We determined if a response was above (H), or below/equal to the control (L). These data were then compared to the estimated above and below the threshold response that would be expected under the assumption of a threshold dose-response (Calabrese et al., 2006).

