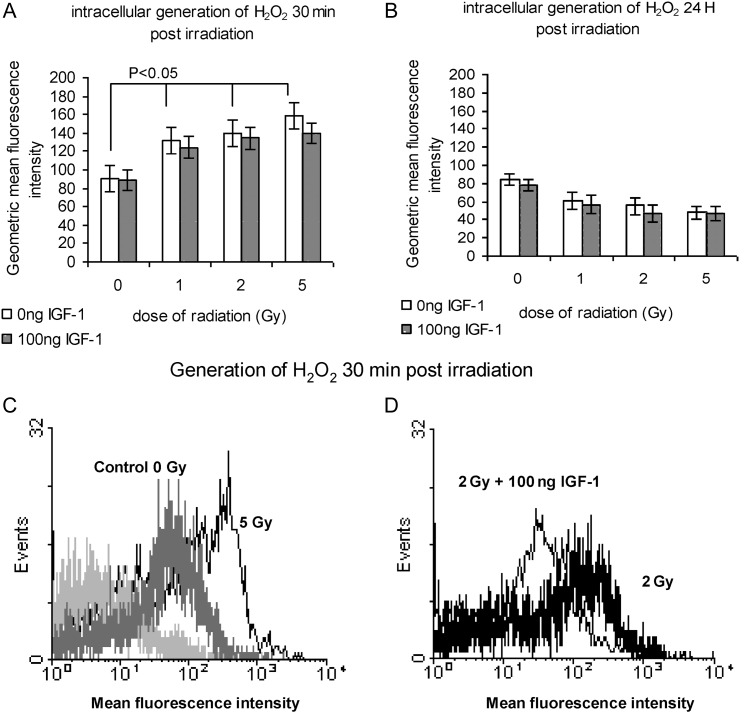
Fig. 2.
Hydrogen peroxide generation in irradiated HPCs-CD34+ cells at 30 min (A) and at 24 h (B) post-irradiation with 1, 2 and 5 Gy; (C) representative histogram showing hydrogen peroxide levels in non-irradiated and cells irradiated with 5 Gy, at 30 min post-irradiation, (D) representative flow cytometry histogram showing the effect of IGF-1 at 2 Gy dose of radiation
The values represent mean ± SE of at least three independent experiments. In (C) the increase of the hygrogen peroxide generation is indicated by the shift of the histogram to the right; in (D) the effect of IGF-1 at a 2 Gy dose of radiation is shown by the shift of the histogram to the left.

