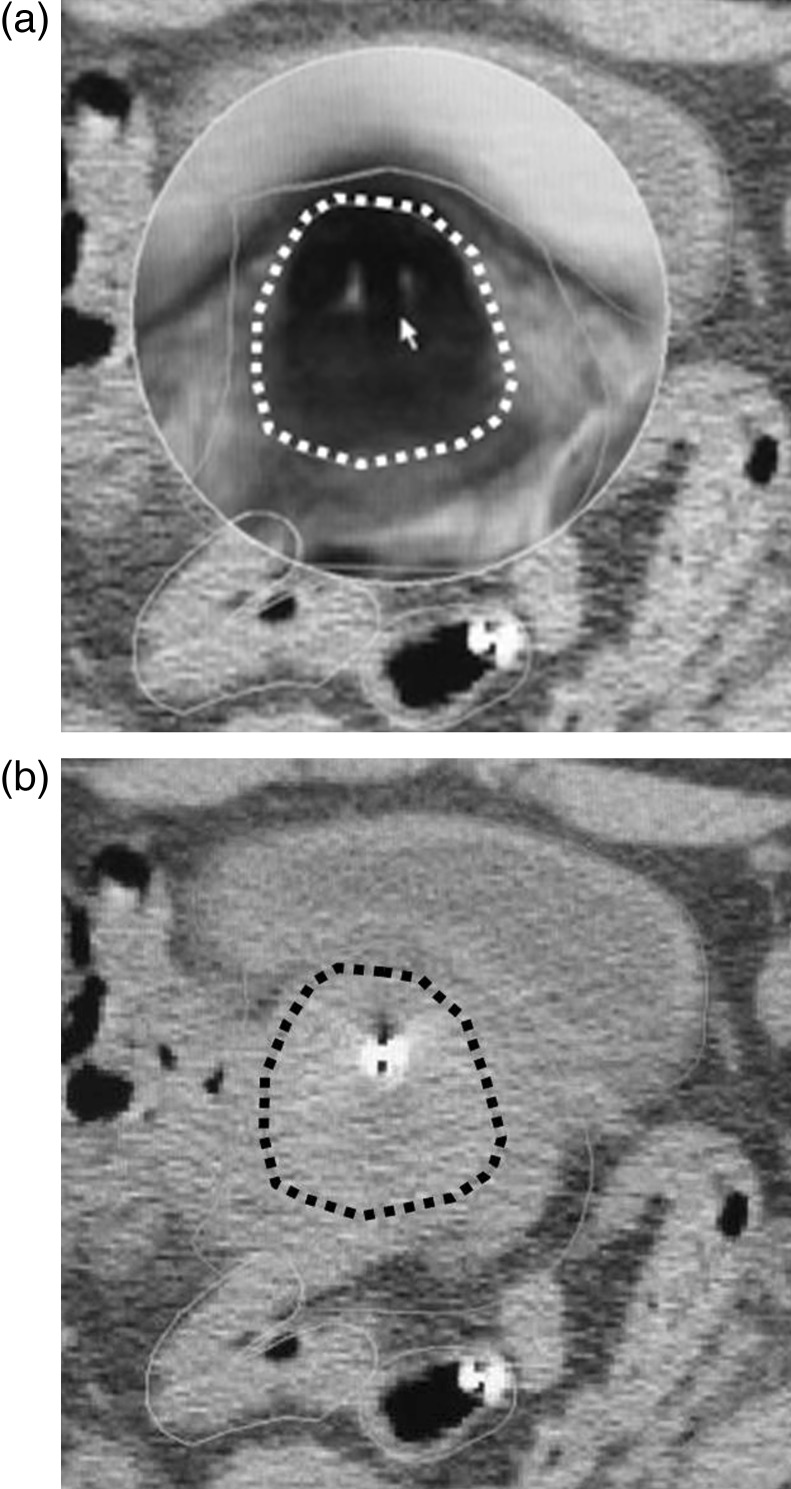
Fig. 1.
(a) computed tomography (CT) image of Patient 1 after insertion of treatment applicator and (b) same CT image as Fig. 1a without superimposition of MRI. (a) A magnetic resonance image (MRI) was superimposed to describe the precise contours of high-risk clinical target volume (HR CTV, white broken line). (b) It was difficult to describe the high-risk clinical target volume (HR CTV) as shown in Fig. 1a. The HR CTV described by CT imaging appears to be of larger volume than that described by MRI (black broken line).

