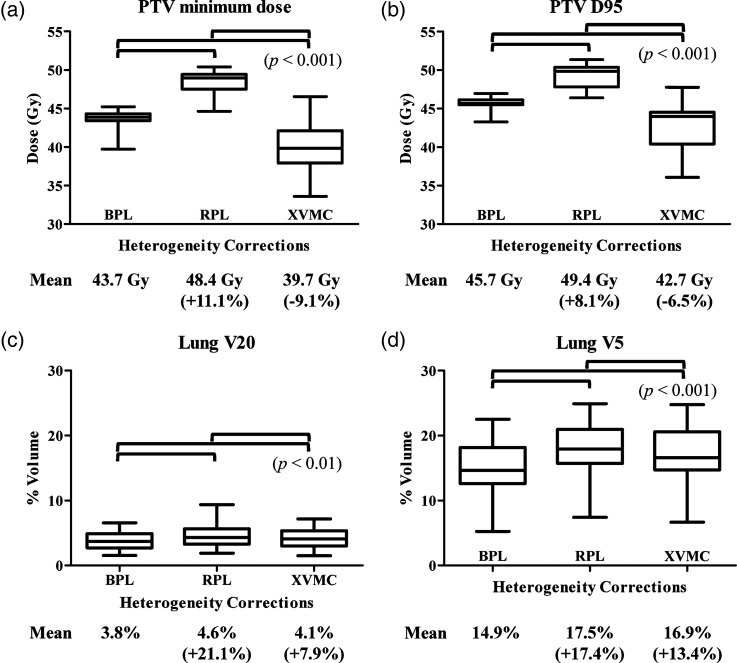
Fig. 1.
Box plots of the minimum dose (a), D95 (b) for the PTV and V20 (c), V5 (d) for the normal lung, when 48 Gy was prescribed at the isocenter using BPL.
With RPL and XVMC, the doses were recalculated under the same monitor units as in BPL. The figures in parentheses indicate the percentages of the mean doses in RPL and XVMC relative to those in BPL. BPL = the Batho power-law correction, RPL = the radiological path length algorithm, XVMC = the X-ray Voxel Monte Carlo algorithm.

