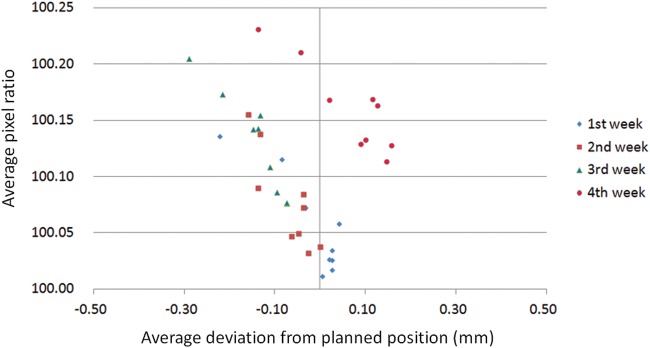
Fig. 10.
Average pixel ratio at every gap or slit location against the average deviation from planned position over 1 month. The X axis shows average deviation from planned position in millimeter and the Y axis shows average pixel ratio. Each symbol shows the average pixel ratio at every gap location (left 8 cm to right 8 cm with 2-cm interval) over 1 month.

