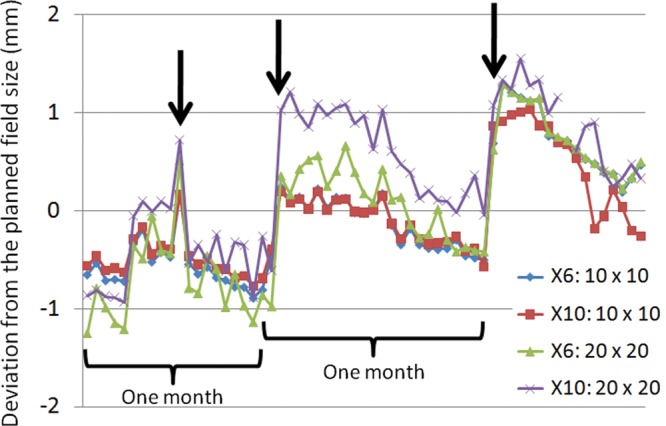
Fig. 12.

Deviations from the planned field size of 10 cm × 10 cm and 20 cm × 20 cm over 3 months. The X axis shows the time of measurement. Each symbol shows deviation from the planned field size in mm for energy levels of of 6 and 10 MV, field size of 10 cm × 10 cm and 20 cm × 20 cm, respectively. Arrows indicate MLC calibration periods.
