
Fig. 6.
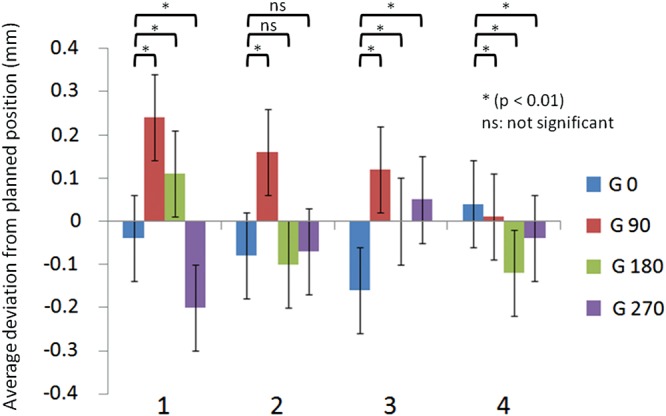
Average deviations from the planned position at four gantry angles over 1 month.
The X axis is measured in weeks. The Y axis shows average deviation from planned position in mm at four gantry angles of 0, 90, 180, 270°. Error bars present one standard deviation. Paired t-test comparisons between gantry angle 0° and the other angles are shown (P < 0.01: significant difference, ns: not significant).