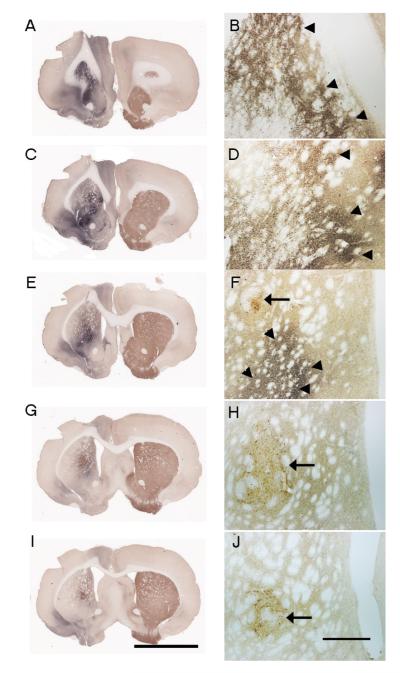
Figure 1.
Photomicrograph displaying human alpha synuclein (Blue-black) and TH (Brown) double peroxidase immunostained sections. A, C, E, G, I represents low power photomicrographs, while B, D, F, H and J represents high power photomicrographs showing TH-ir grafted cells and virally expressed human alpha synuclein protein. Arrowheads represent the human alpha synuclein vector injection and arrows represent the grafted cells injection site. Note the presence of grafted cells in the absence of human alpha synuclein immunoreactivity directly from the injection indicating that the grafted cells were not directly transfected by the vector. Scale bar in I represents 5mm and applies to (A, C, E, G, I). Scale bar in J represents 500μm and applies to (B, D, F, H, J) respectively.

