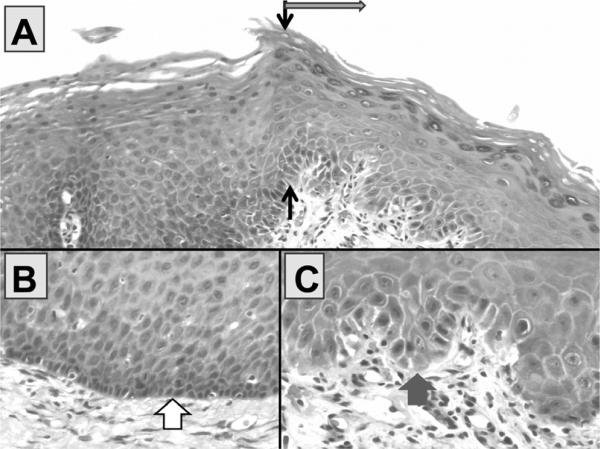
Fig. 6.
In Panel A (H&E ×200), the black arrows demonstrate the sharp linear transition between an area of mild epithelial hyperplasia of the oral cavity and dysplastic leukoplakia (in direction of gray arrow). A higher power view (×600) of the basal area of the hyperplasia is shown in Panel B and Panel C shows a high power view of the base of the dysplastic leukoplakia. Note that the nuclei are larger in the dysplastic leukoplakia (fat gray arrow) and that the basal area is disorganized and lacks apparent cellular cohesion as compared with the area of mild hyperplasia (fat white arrow). The dysplastic cells demonstrate nuclear accumulation of p53 in about 30% of the basal cells in the area of dysplasia (not shown) and none in area of hyperplasia (not shown).

