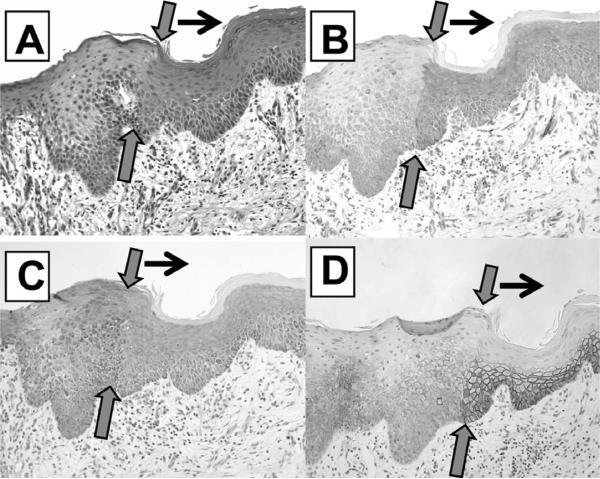
Fig. 7.
The panels A–D of Fig. 7 represents a linear transition from mild hyperplasia of the epithelium of the oral cavity to epithelial dysplasia with the separation marked by the gray arrows and the black arrows pointing to the area of dysplasia. Panel A (×200, H&E) represents the histomorphology of this lesion. Panel B (×200, TGFα) demonstrates how increased expression of TGFα follows the exact linear transition of the epithelial boundary as does EGFr in Panel C (×200, EGFr) and CD44v6 in Panel D (×200, CD44v6). Increased proliferation follows this same pattern (data not shown). As will be discussed subsequently, differentiated expression of molecular markers and proliferation follow the boundary of dysplasia almost exactly. The overlap of increased expression of TGFα and EGFr would be characteristic of an area of autocrine interaction.

