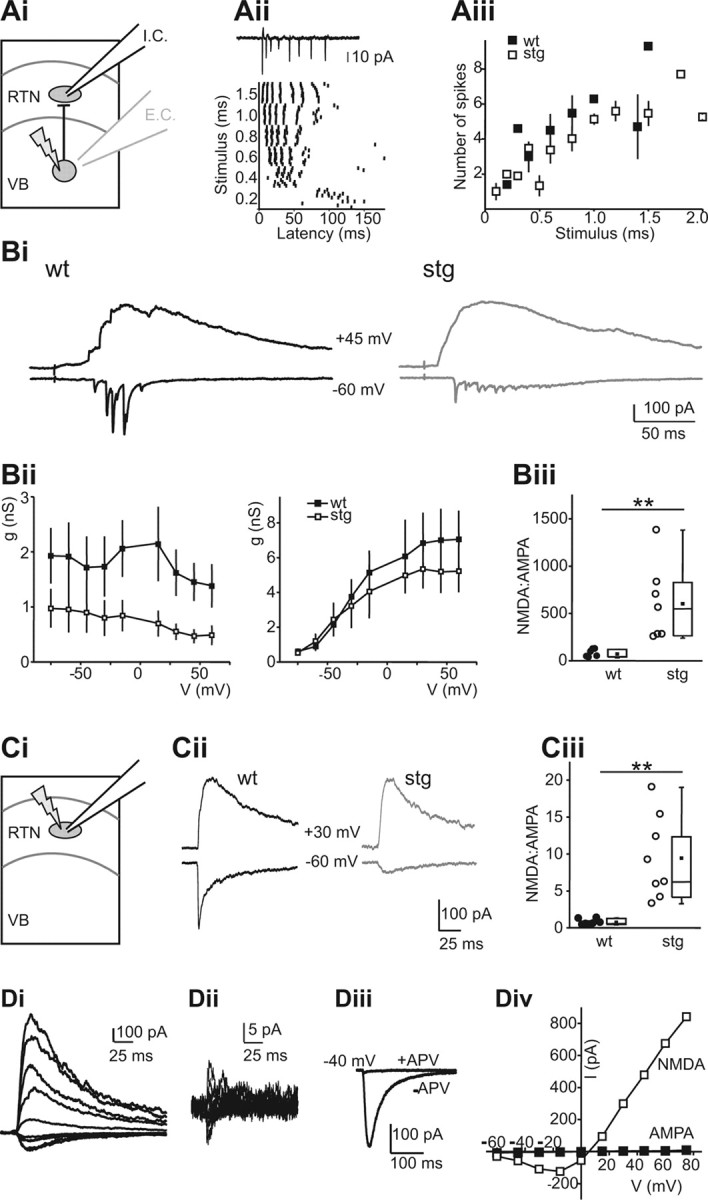
Figure 8.

Specific reductions in AMPAR responses at intrathalamic synapses. Ai, Activation of synaptic currents in RTN neurons resulting from LSPS induced burst firing in VB. E.C. indicates extracellular recording from VB neurons (gray electrode in VB, Aii, Aiii), and I.C. indicates intracellular recording from RTN neurons (black electrode in RTN, Bi–Biii). Aii, Action potentials in a WT VB neuron in response to LSPS. Action potentials were recorded via an extracellular recording in cell-attached mode (see trace on top). The graph (bottom) shows spike times at different duration stimuli in that neuron. VB neurons typically fired action potential bursts in response to LSPS. Aiii, Comparison of action potential bursts generated in VB neurons of WT (n = 4) and stg (n = 6) reveals no significant differences. Bi, LSPS eEPSCs in WT (left) and stg (right) RTN neurons. EPSCs were evoked at −60 mV (bottom traces, mainly AMPA) and +45 mV (top traces, mainly NMDA). Bii, AMPAR (left) and NMDAR (right) conductance at different holding potentials in WT (n = 6) and stg (n = 5) RTN cells. AMPA, but not NMDAR, conductance is reduced in stg. Biii, NMDA/AMPA ratio EPSCs in WT and stg RTN neurons. Higher ratio in stg is attributable to a smaller AMPA component (WT, 82.6 ± 16.7, n = 6; stg, 618.3 ± 154.6, n = 7; p < 0.01). Ci, Direct activation of RTN neurons by LSPS. Cii, Direct uncaging responses evoked at holding potentials of −60 and +30 mV in representative WT and stg (stg−/−) neurons. Note absence of fast, presumably AMPAR-mediated, component in stg. Ciii, NMDA/AMPA ratios were significantly greater in stg, reflecting the decreased AMPA component (WT, 0.76 ± 0.15, n = 7; stg, 9.44 ± 2.0, n = 8; p < 0.01). Di, Direct currents in an stg RTN neuron at holding potentials between −60 and +60 mV. Dii, Direct current in the same neuron, after application of 50 mm d-APV, evoked as in Bi. Diii, Comparison of glutamatergic currents evoked at −40 mV before and after NMDAR block. Div, I–V curve for NMDAR- and AMPAR-mediated currents (peak currents in Di and Dii, respectively). **p < 0.01.
