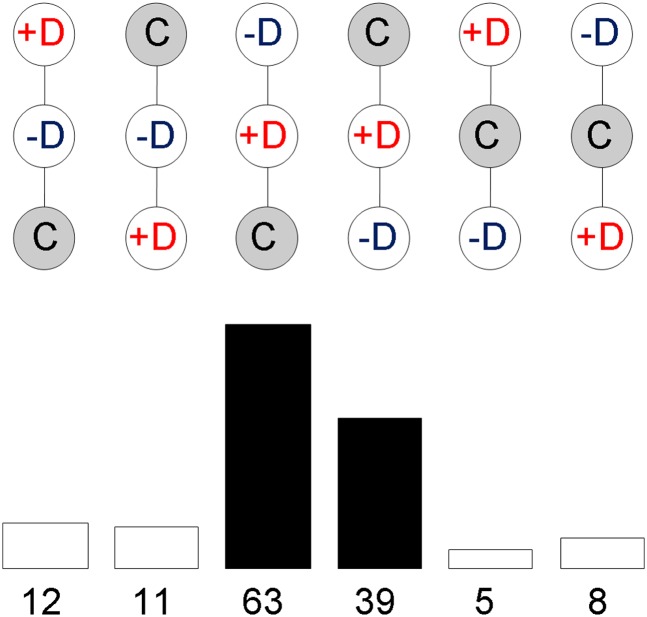
Figure 6 .
Number of probes SAM-selected for Inb and Dep effects for different patterns of expression. Relative rankings of sublines (C, outbred controls; +D, most depressed; –D, least depressed) expression levels in probe sets showing both inbreeding (Inb) and depression (Dep) effects (FDR < 0.1 in both cases) and their frequencies. The black bars correspond to probes with the most depressed samples in the intermediate positions, corresponding to the protective configuration given in Figure 1.

