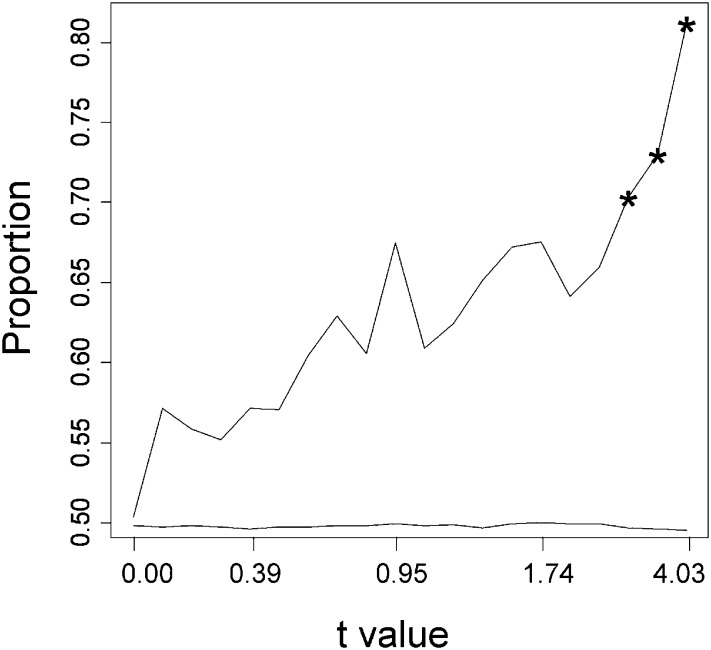
Figure 7 .
Proportion of probes showing a protective pattern of expression (see Figure 1) after ranking the 9133 expressed probe sets according to their Student’s t absolute value in the most depressed vs. least depressed test and dividing the rank in 20 tiers of size 456 (except the last one, of size 469). Thus, the right-hand part of the figure indicates probes where there is a large difference in expression between the most depressed and the least depressed sublines, and those on the left-hand side are probes where this difference is low. The lower line (without symbols) corresponds to the average proportion after 1000 randomizations of the expressions for the inbred sublines. Asterisks indicate a significant difference (P < 0.05) between the observed proportion and that obtained after randomization.

