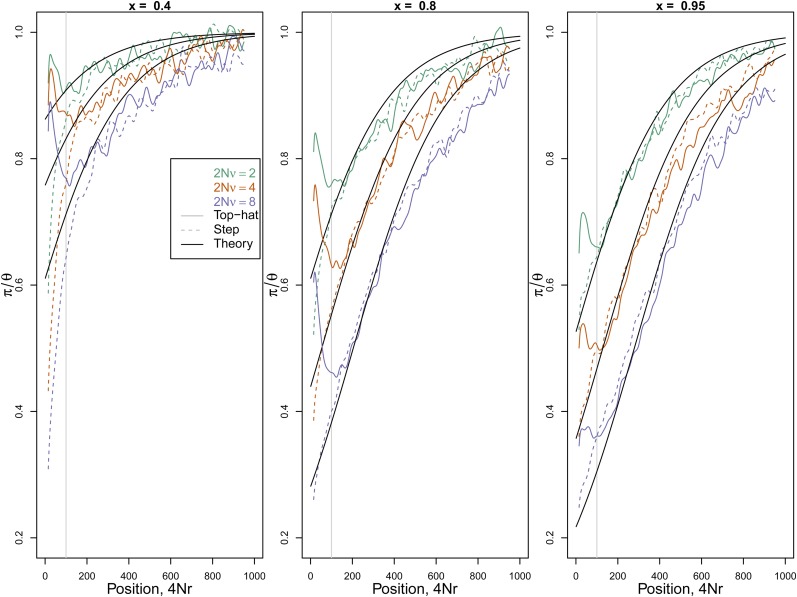
Figure 3 .
Reduction in diversity (π/θ) as a function of recombination distance from a site experiencing recurrent sweeps. The three panels are for different values of the frequency x that each sweep reached rapidly. The solid line is for recurrent top-hat trajectories and the dashed line for recurrent step trajectories The time that the trajectory pauses is T/2N = 0.01 and tx/2N = 0.003 in both cases. The three colors correspond to three different population-scaled rates of sweeps: 2Nν = 2, 4, and 8. The vertical gray line marks recombination distance r > 1/T from the selected locus, above which the dynamics subsequent to reach x should make little difference. The solid black lines give the prediction of (19).

