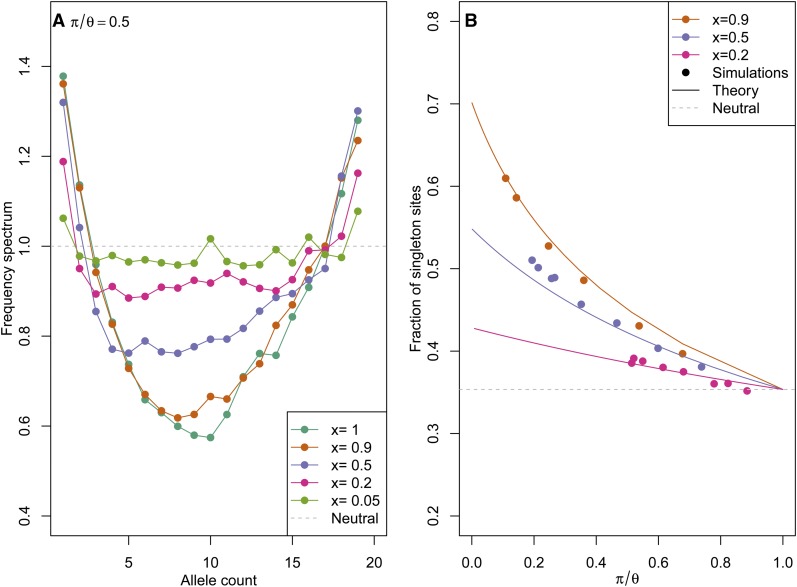
Figure 4 .
Properties of the frequency spectrum with sweeps occurring at a fixed genetic distance. Coalescent rates are given by Equation 9, with q fixed to and txr = 0.6, across a range of x. (A) The percentage of segregating sites found at frequency 1 ≤ k ≤ 20, relative to the neutral expectation (i.e., ). In these simulations the rate of sweeps Nν has been fixed to result in a 50% reduction in diversity. The dashed gray line gives the neutral expectation. (B) The mean number of singletons divided by mean number of segregating sites, from mssel simulations with a sample size of 10 at a neutral site a distance 2Nr = 200 from a selected site. The selected allele performs a recurrent top-hat trajectory (with N = 10,000 and tx/2N = 0.003, giving rtx = 0.6, and pausing T/2N = 0.01) to frequency x = 0.2, x = 0.5, or x = 0.9 across a range of 2Nν. Note the span of π/θ is smaller in the low-x simulations as the effect on diversity of a given 2Nν is smaller. Solid lines show the analytical approximation for [T1]/[Ttot] of Appendix B. The dashed gray line gives the neutral value of the expected proportion of singletons .

