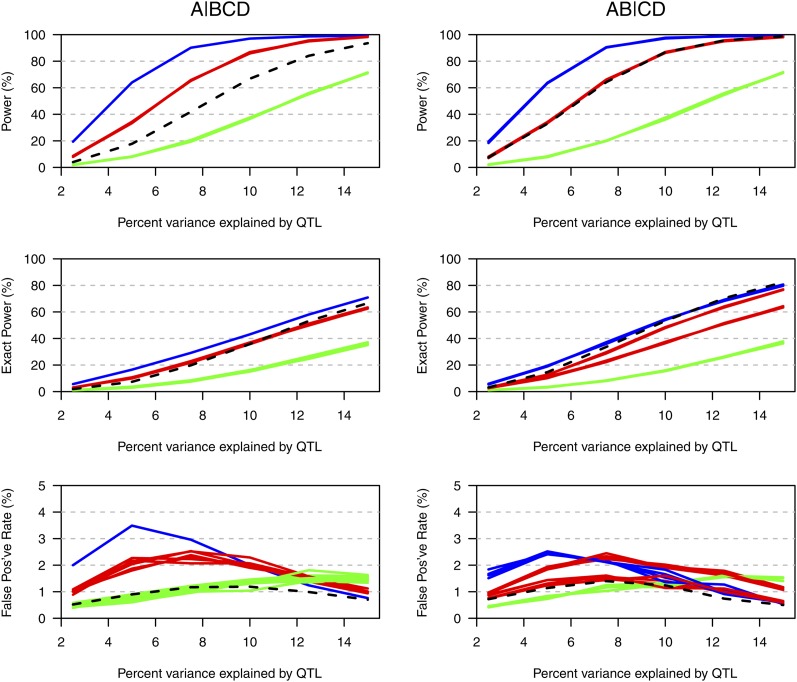
Figure 4 .
Estimated power (top), “exact” power (middle), and false-positive rates (bottom) in the case of four taxa with a total sample size of 450, as a function of the percentage phenotypic variance explained by the QTL. The black dashed curves correspond to the use of all six possible crosses. The other curves are for the various choices of a minimal set of three crosses, with the curves in blue, red, and green corresponding to cases in which three, two, and one of the crosses are segregating the QTL, respectively. The results are based on 10,000 simulation replicates, with analyses considering all possible partitions of the taxa.

