Figure 4 .
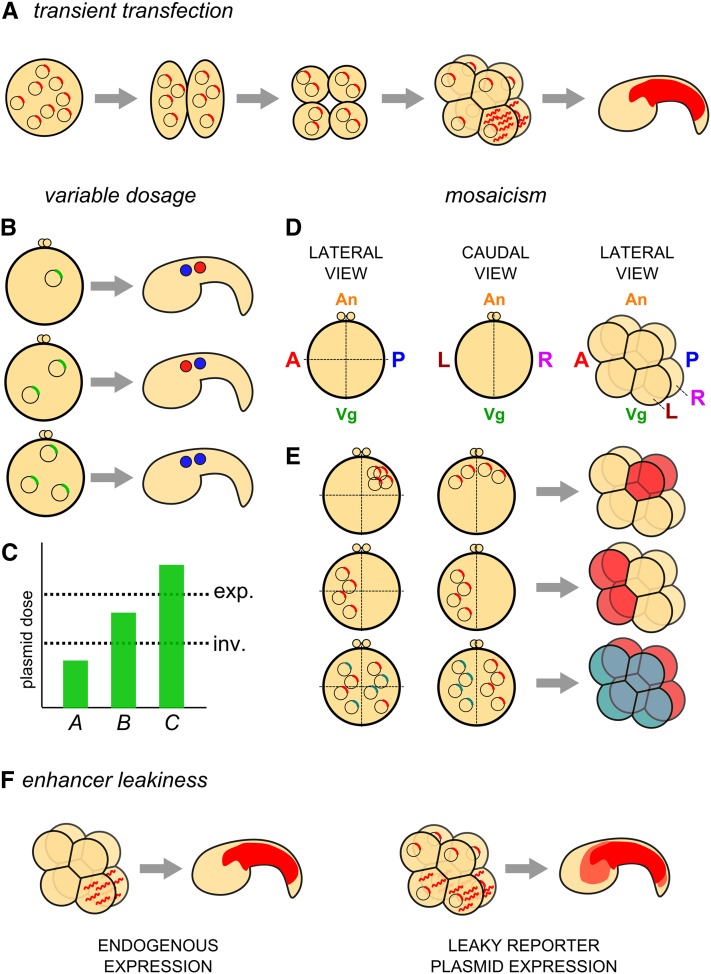
Caveats of the electroporation technique. (A) Diagram of the principle of transient transfection of Ciona embryos with plasmid DNA. Plasmid molecules are nonreplicative and segregate randomly, presumably as extrachromosomal DNA “arrays.” Transcription of a transgene in a given cell (determined by the activity of the driver) will result in inheritance of mRNA and/or resulting protein by all descendants of the cell. Given the short developmental time of Ciona (16 hr from fertilization to hatching), most reporters expressed during early embryogenesis are still visible late in development. (B and C) Diagram of possible outcomes of variable penetrance of a given perturbation transgene, presumably due to variation in total molecules of plasmid DNA taken up by the embryo at electroporation. (B) An embryo transfected with n copies of a plasmid carrying a gain-of-function gene (top) might not show any phenotype when compared to an unelectroporated control. If 2n copies of the same plasmid are transfected into an embryo, a given phenotype might occur. In this example, the fates of two cells are inverted along the anterior–posterior axis (middle). In embryos transfected with 3n copies of the plasmid, a qualitatively different phenotype might occur, in this case, an expansion of the anterior cell fate (blue) and the expense of its posterior neighbor (red) (bottom). (C) These outcomes can be interpreted as being due to different thresholds of plasmid dosage required for either phenotype (inv., inversion of cell fates; exp., posterior expansion of the anterior cell fate). Remembering that, we have little control over how many copies of the plasmid go into each embryo, meaning in any given batch of electroporated embryos, one will see the whole range of plasmid dosage represented. (D) Diagram of one-cell Ciona zygotes, viewed laterally (left) or caudally (center), and an eight-cell–stage embryo viewed laterally (right). Major embryonic axes and coordinates are indicated (A, anterior pole; P, posterior pole; An, animal pole; Vg, vegetal pole; L, left hemisphere; R, right hemisphere). (E) Model for mechanism underlying mosaicism in electroporated embryos. Expected mosaic expression patterns at the eight-cell stage (right) given the localization of plasmid DNA before the first cleavage (left and center, representing lateral and caudal views of the same embryo, respectively). Top: plasmid that is taken up primarily at the posterior, animal pole on either side of the embryo results in expression (red fill) in the cells that derive from this part of the zygote. Center: plasmid taken up at the anterior pole of the left side of the embryo will result in expression in only the anterior/left-derived cells. Bottom: mutually exclusive uptake of distinct plasmids (represented by blue and red transgenes) by left and right hemispheres after sequential electroporations will result in mutually exclusive, left–right expression of these plasmids (blue and red fill, respectively; see Figure 3C). (F) Diagram of the transcription of a reporter gene by a “leaky” driver (right), that is, one that does not faithfully recapitulate the expression of the endogenous gene from which it was derived, as assayed by in situ hybridization or immunostain (left), being somewhat active in other cells not normally expressing the endogenous gene, labeling the descendants of these cells with lower (though sometimes equal or stronger) levels of reporter gene protein.

