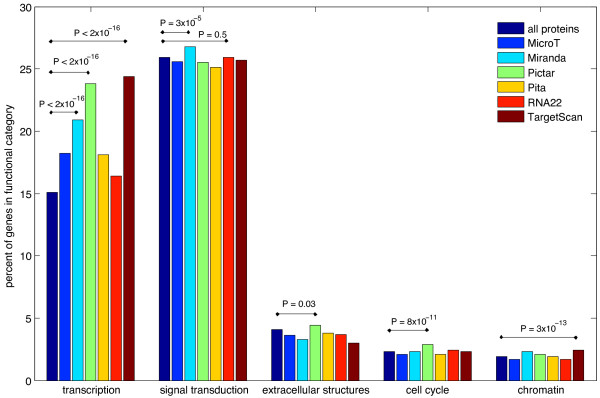
Figure 2.
Abundance of 6 different miRNA target prediction methods by functional category. All proteins compared to 6 miRNA target prediction methods’ proteins by eggNOG functional category. P-values are calculated from a Fisher Exact test comparing all proteins to each methods’ predicted target proteins.

