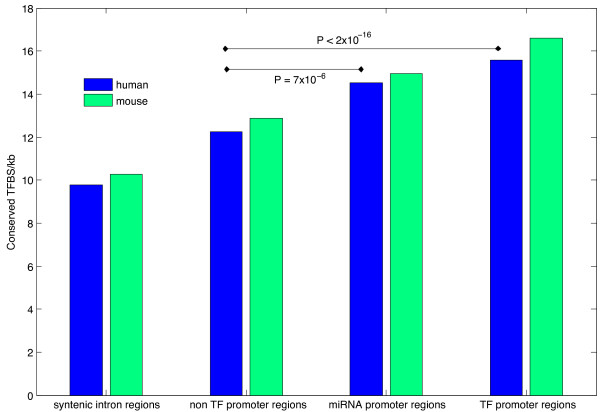
Figure 4.
Conserved transcription factor binding site densities in mouse and human promoter regions. Conserved transcription factor binding site density for mouse and human transcription factor, non transcription factor and miRNA promoter regions compared to syntenic intronic regions. P-values are calculated from a Fisher Exact test comparing non TF promoter regions with miRNA and TF promoter regions.

