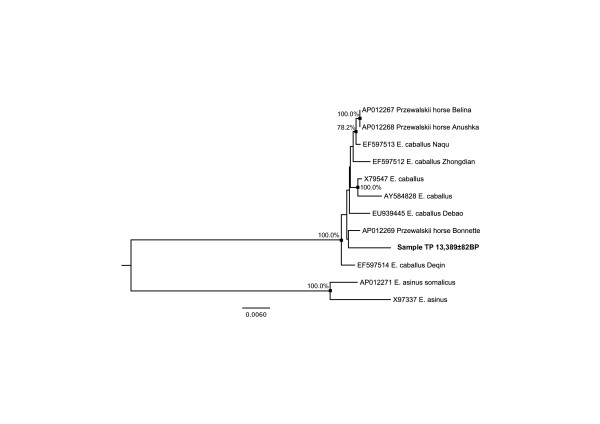
Figure 5.
Phylogenetic relationships among ancient and modern horses. All sequences were downloaded from GenBank, except for sample TP that has been analyzed for the first time in this study. Accession numbers are reported together with available information about the different samples considered. The analysis was restricted to sites showing a minimal coverage depth of 2 and >50% of sequence identity among reads (11,316 sites). Phylogenetic inference is performed with Maximum Likelihood using a HKY + Γ 8 model of molecular evolution including a gamma correction for rate heterogeneity among sites. Node supports are estimated from a total number of 1,000 bootstrap pseudo-replicates and are reported for those above 75%.

