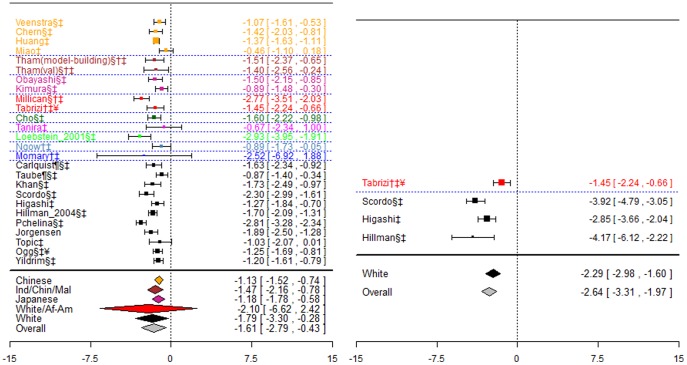
Figure 3. Forest plots for association between CYP2C9*3 and stable dose.
Effect estimates are differences in means and 95% confidence intervals. ¶: Ethnicity of patients is unclear, although likely to be predominantly White so included in sensitivity analysis of White ethnic group. §: Paper does not mention genotype quality control procedures, so reliability uncertain.†: Paper does not mention tests for population stratification, which is of concern since more than one ethnic group included.‡: Paper does not mention assessing compliance with treatment. ¥: Studies reported results assuming a dominant mode of inheritance. The effect size estimated is therefore for heterozygotes and mutant-type homozygotes combined versus wild-type homozygotes.

