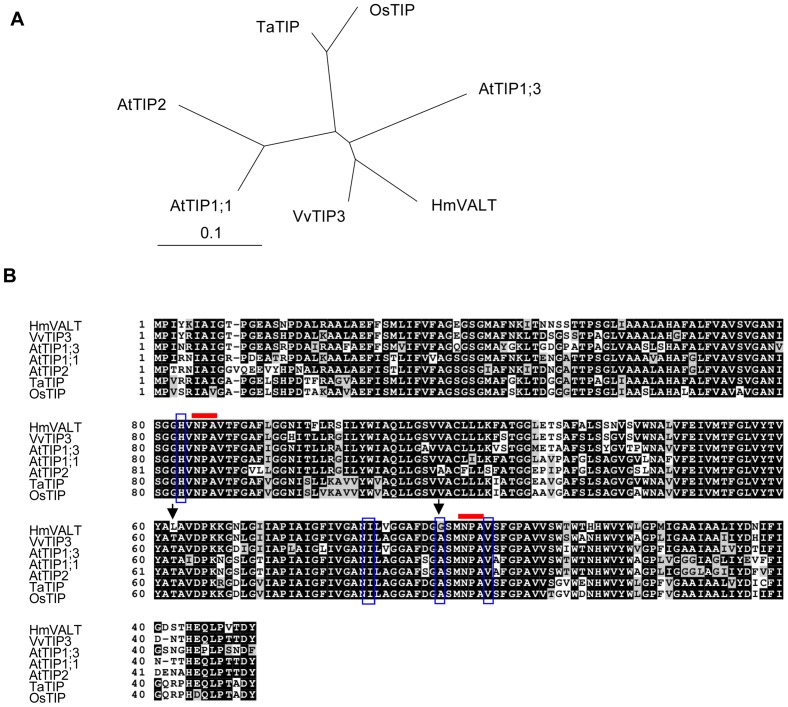
Figure 4. Comparison of HmVALT and the TIP proteins.
(A) Phylogenetic tree was generated from a ClustalW alignment of HmVALT and selected TIP amino acid sequences using TreeView 1.6.6. (B) Alignment of the HmVALT and similar amino acid sequences in Figure 4A. Black and gray boxes indicate identical and similar amino acids, respectively. The red bars above the alignment denote the positions of the NPA motif. The aligned ar/R selectivity filter residues are highlighted in vertical blue boxes. The positions that are indicated by black arrows were mutated in the analysis of the yeast Al-sensitivity test (Figure 8). Sequences acquired from accessions: VvTIP3 [AAF78757], AtTIP1;3 [NP192056], AtTIP1;1 [NP_181221], AtTIP1;1 [NP_189283], TaTIP [ABI96817], OsTIP [NP_001045562].

