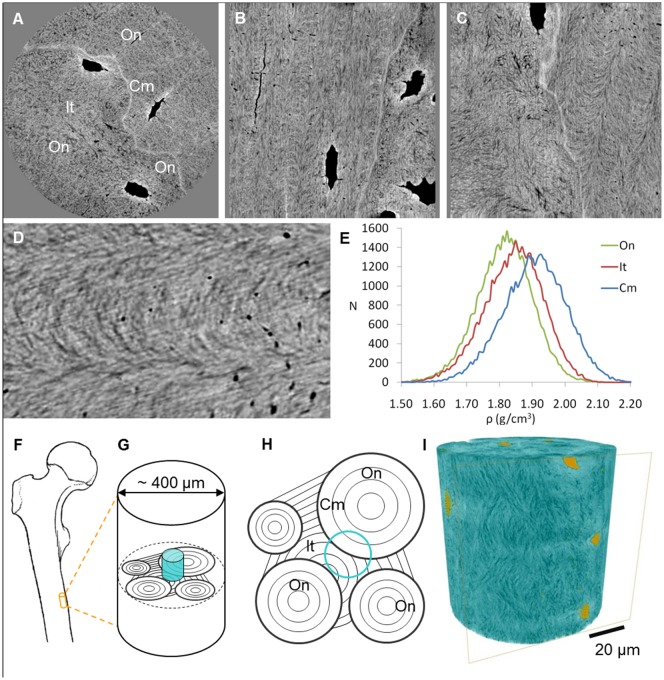
Figure 2. Retrieved information in the reconstructed images.
[a] Transverse, [b] frontal and [c] sagittal slices through the images reconstructed from phase data. Grayscale is proportional to local density. Osteocyte lacunae [Lc] and canaliculi [Ca] can clearly be seen. The heterogeneous organization of the matrix by mineralized collagen fibers can also be distinguished [box]. In this sample, a continuous change in collagen orientation can be seen between adjacent lamellae. The cement line [Cm], separating osteonal [On] and interstitial [It] tissue, can clearly be distinguished as more mineralized than the surrounding matrix. Tissue close to osteocyte lacunae is also hypermineralized. [d] Zoom on the boxed area in C. Matrix orientation is clearly visible and canaliculi are seen as black dots. [e] Mass density histograms in the three tissue types. [f] Samples were extracted from the mid diaphysis of a human femur. [g] The blue cylinder shows the imaged region inside the sample. [h] Schematic of a transverse section showing the organization of lamellar bone in osteons, interstitial tissue and cement lines. Blue circle shows the positioning of A. [i] Rendering of the electron density in the sample [blue] and porosity [yellow]. Structures such as osteocyte lacunae [Lc] and canaliculi [Ca], the cement line [Cm] and collagen fibers are revealed.

