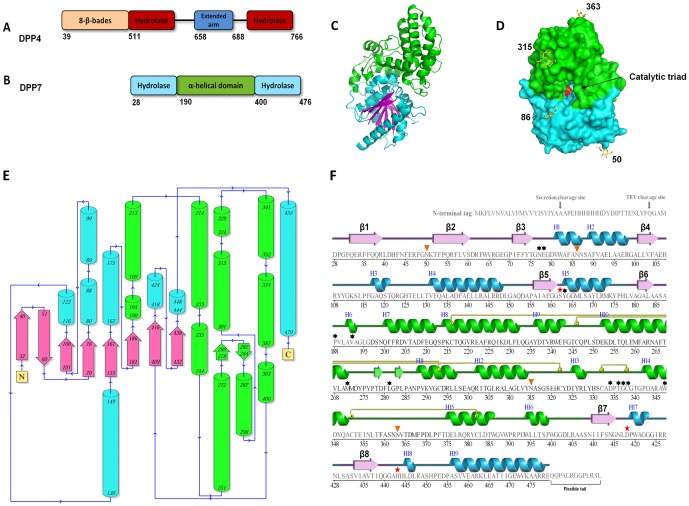
Figure 1. Structure of DPP7.
(A) Schematic showing the DPP4 domain structure. The domains are represented as boxes and their borders are indicated. The propeller domain is in yellow, the hydrolase domain in dark red and the extended arm in blue. (B) Schematic showing the DPP7 domain structure aligned with that of DPP4. The hydrolase domain is in aquamarine and the big α-helical (SKS) domain in green. (C) Ribbon presentation of the DPP7 protomer structure. The domains are colored as in (B) with the β-strands characteristic for the hydrolase fold presented in magenta. (D) Surface representation of the DPP7 protomer. The domain is colored as in (B) and (C). The catalytic triad (Ser162, Asp418 and His443) is shown in red. The carbohydrates identified in the molecule are represented as sticks and colored ‘per atom’ (yellow, blue and red for C, N, and O, respectively). The corresponding amino acid numbers are shown in black. (E) Topology diagram evidencing how the new fold is positioned in relation to the catalytic fold. Color code is the same of Figure 1. (F) Expressed sequence information. Secondary structure of DPP7 was aligned to the amino acid sequence. Residues without secondary structure are not observed and presumed flexible. The color code is the same as in the previous figures. The catalytic triad (Ser162, Asp418 and His443) is indicated by a “red star”. The strands are represented by arrows and helices by bars. The glycosylated residues identified in the electron density map are marked with orange triangles and the suggested inhibitor interacting residues with asterisks. Disulfide bonds are indicated by yellow circles linked to the corresponding partners by yellow bars. Items C and D were prepared using the program PyMOL (http://www.pymol.org/).

