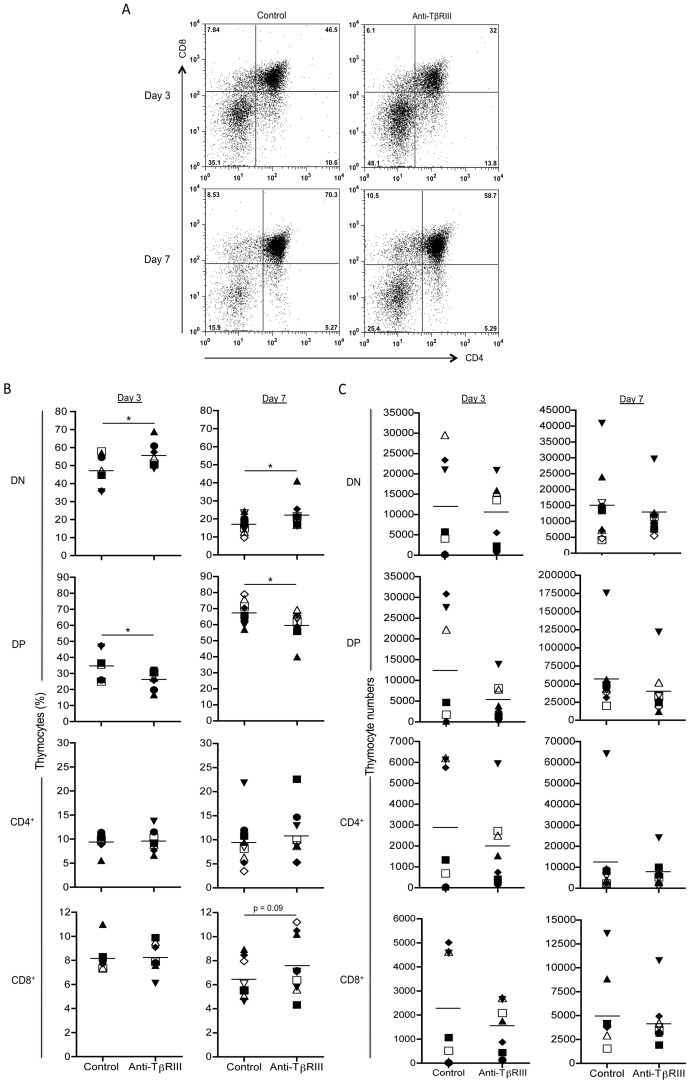
Figure 3. The blocking of TβRIII in FTOCs alters T cell development.
E14 thymic lobes were cultured in the presence of anti-TβRIII antibody or in the presence of pre-immune serum (control lobe). At day 3 and 7 of culture thymic lobes were disaggregated, counted and stained with antibodies to CD4, CD8. (A) Representative CD4 versus CD8 staining dot plots. (B). Comparative graphs represent the percentages of DN, DP, CD4SP and CD8SP thymocytes obtained after 3 and 7 days of culture between both treatments. (C) Analysis of cell numbers in non-treated and anti-TβRIII treated FTOCs at day 3 and 7. Data are representative of two independent experiments. Mean values ± SEM are shown (n = 7 per group for day 3, and n = 9 per group for day 7). Asterisks indicate *p≤0.05.

