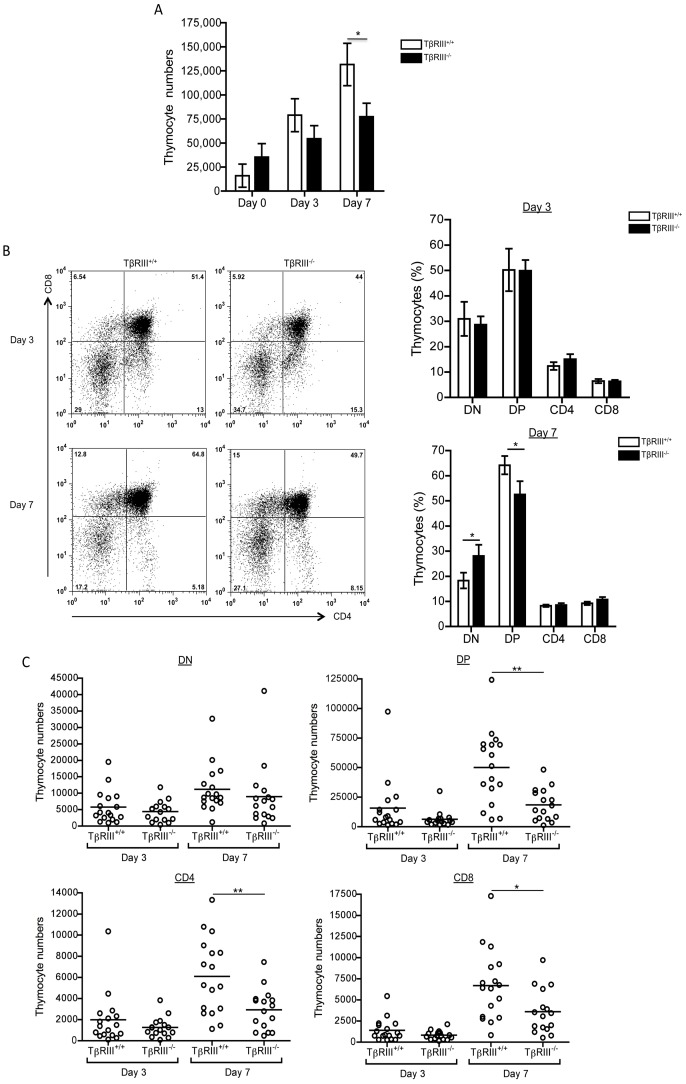
Figure 4. TβRIII−/− fetal thymi display an altered T cell development.
(A) Graph of thymocyte numbers at days 0, 3 and 7 from E14 TβRIII+/+ and TβRIII−/− fetal thymic lobes, respectively. (B) Representative CD4 versus CD8 staining dot plots from TβRIII+/+ and TβRIII−/− fetal thymic lobes at days 3 and 7 of culture. Summary of experiments showing the percentage of each thymocyte subsets from TβRIII+/+ and TβRIII−/− FTOCs at days 3 and 7. (C) Analysis of total cell numbers in gated DN, DP and CD4SP and CD8SP thymocytes from TβRIII+/+ and TβRIII−/− fetal thymi. Data are representative of three independent experiments. Mean values ± SEM are shown, TβRIII+/+ n = 17 and TβRIII−/− n = 16. Asterisks indicate *p≤0.05 and **p≤0.01.

