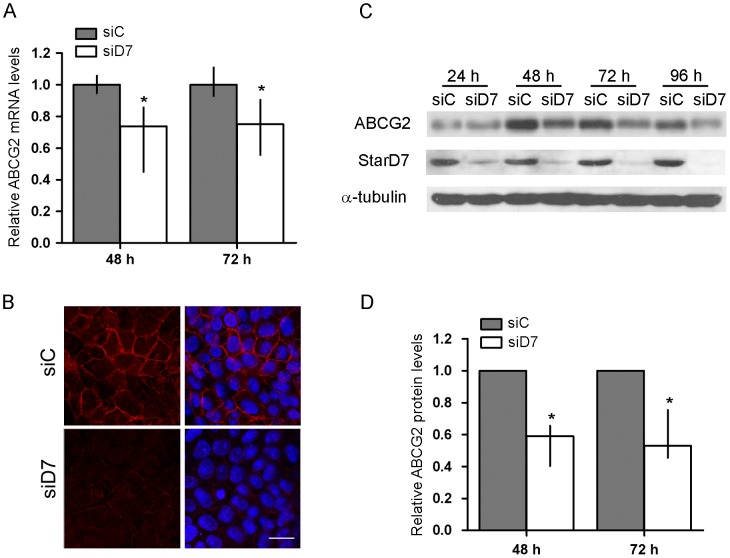
Figure 2. Effect of StarD7 siRNA on ABCG2 mRNA and protein expression in JEG-3 cells.
A- Cells were transfected with 200 nM of StarD7.1 or scrambled siRNAs and cultured for 48 h or 72 h. ABCG2 expression was determined by real-time quantitative PCR. Results are expressed as ABCG2 mRNA expression in StarD7 siRNA-transfected cells after normalizing to cyclophilin A relative to the corresponding normalized mRNA levels in scrambled siRNA-transfected cells. The values represent the median and 25 th–75th% percentiles of at least three independent experiments performed by triplicate. B- Confocal microscopy images demonstrating membrane expression of ABCG2 protein (red) in scrambled siRNA-treated JEG-3 cells (siC, upper panel) and low or absent ABCG2 immunostaining in StarD7 siRNA-treated cells (siD7, bottom panel). The nuclei were labelled with Hoescht (blue) and merge images are shown on the right. Bar = 20 µm (×600). C- Cells were transfected with 200 nM of StarD7.1 siRNA or 200 nM of scrambled siRNA and cultured until 96 h. ABCG2 protein expression was analyzed by western blot. Protein extracts (100 µg/lane) from scrambled siRNA- (siC) or StarD7 siRNA-transfected (siD7) cells were electrophoresed on a 7.5% SDS polyacrylamide gel and transferred to a nitrocellulose filter. Filters were incubated with anti-ABCG2 (top), anti-StarD7Ct (middle) and with the monoclonal anti-α-tubulin antibodies (bottom). These immunoblots are representative of at least three separate experiments. D- The bar graph represents the densitometric quantification of ABCG2 protein levels in StarD7 siRNA-transfected cells normalized to α-tubulin of at least four separate experiments relative to the corresponding normalized protein levels in scrambled siRNA-transfected cells (median and 25th–75th% percentiles). *p<0.05 compared to scrambled siRNA-transfected cells.

