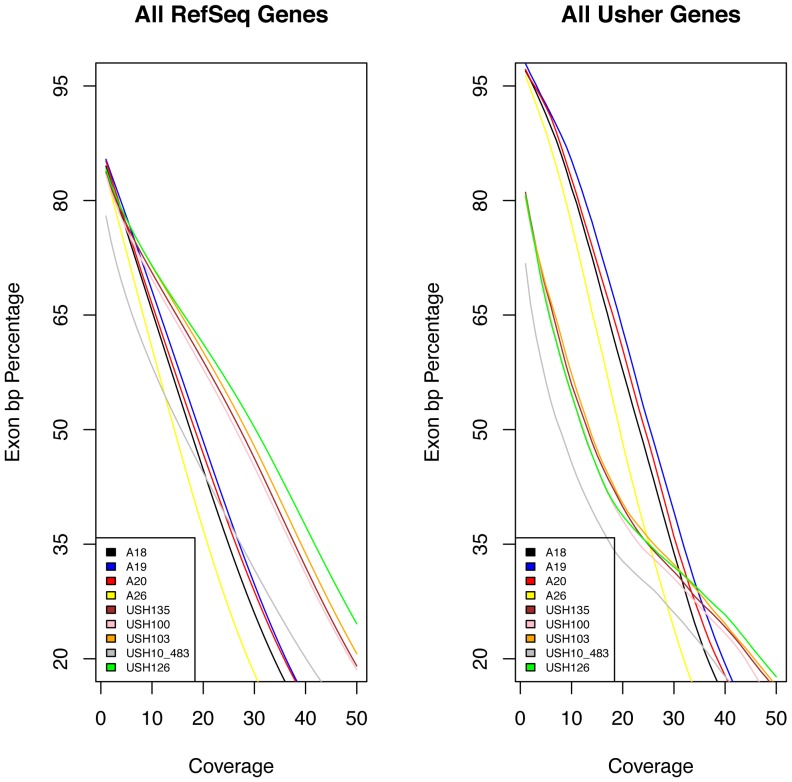
Figure 2. Coverage data for whole exome sequencing.
A) Relationship between the minimum depth coverage and the extent of basepairs of RefSeq exons sequenced (shown in percentage). B) Relationship between the minimum depth coverage and the extent of basepairs of Usher exons sequenced. Solid colored lines represent different samples, x axis: minimum coverage increasing from left to right up to 50×; y axis: percentage of exons sequenced.

