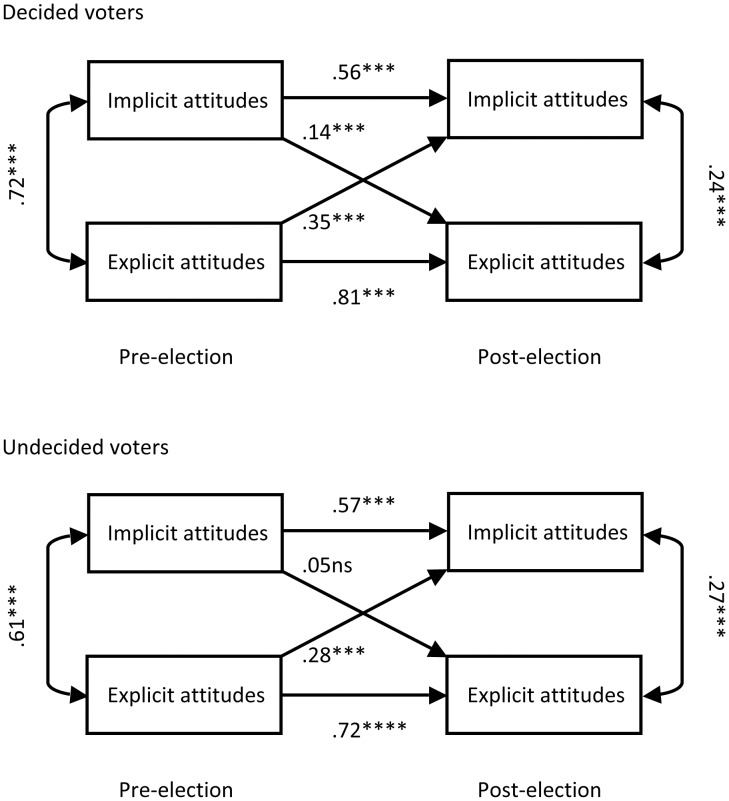
Figure 2. Implicit and explicit attitude change in Study 2.
Two-wave-two-variable panel design analysis of implicit and explicit attitude change between the pre- and post-election assessments for decided (n = 366) and undecided (n = 186) voters in Study 2. Implicit attitudes were indicated by the ‘political camps IAT’. Horizontal arrows indicate stability, diagonal arrows indicate change. Numbers represent standardized beta values of simultaneous multiple regression analyses (***p<.001; ns: not significant).

