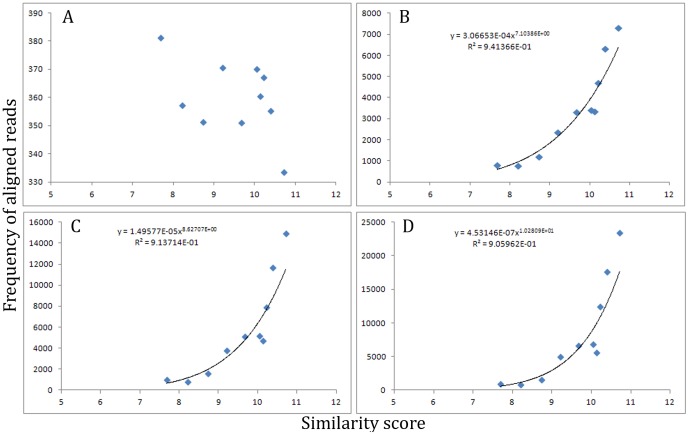
Figure 3. Similarity score of sequences to a motif is predictive of frequency.
Similarity of each chromosomal position to the discovered (parent) motif was calculated as a stand in for relative affinity using a linear nucleotide position matching algorithm (see methods ). All positions were ranked and the mean similarity score of groups of 100 with serially lower affinity scores were plotted against the mean frequency of those positions. The x-axis left margin is 5 because a bit score of 0 (the statistical similarity between random sequences) should be 5.25 for the parent motif under investigation. The rightmost edge of the x-axis represents the discovered highest similarity (11.25) of a single region of the chromosome to the discovered parent motif, representing a best fit and thus maximal similarity of the set. (a) The similarity scores in the initial (unselected) library did not produce a statistically significant trend when subjected to regression analysis. (b–d) The similarity scores from sequential sequence cycles of afSELEX-seq against their corresponding frequencies revealed exponential regression models (black lines) with r2 values all over 0.90.

