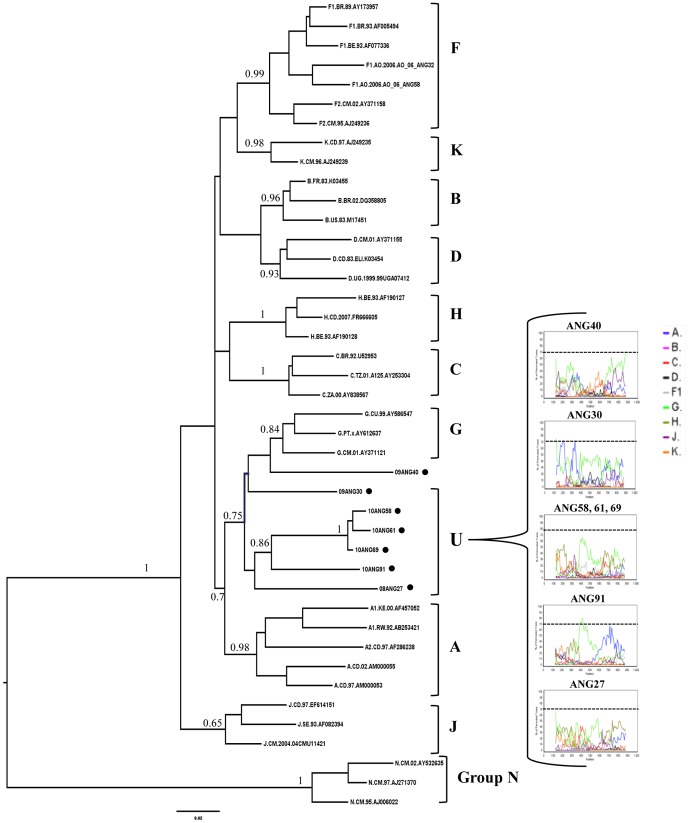
Figure 4. B. ML tree of the pol (PR/RT) region of Angolan sequences classified as U (black circles) plus reference sequences from all HIV-1 subtypes.
aLRT values are only shown at key notes. The scale represents number of substitutions per site. Bootscanning plots of Angolan U strains are shown. Only one representative bootscanning plot is shown for the phylogenetically related Angolan U sequences ANG58, ANG61 and ANG69. The dashed line indicates the cut-off of 70%.

