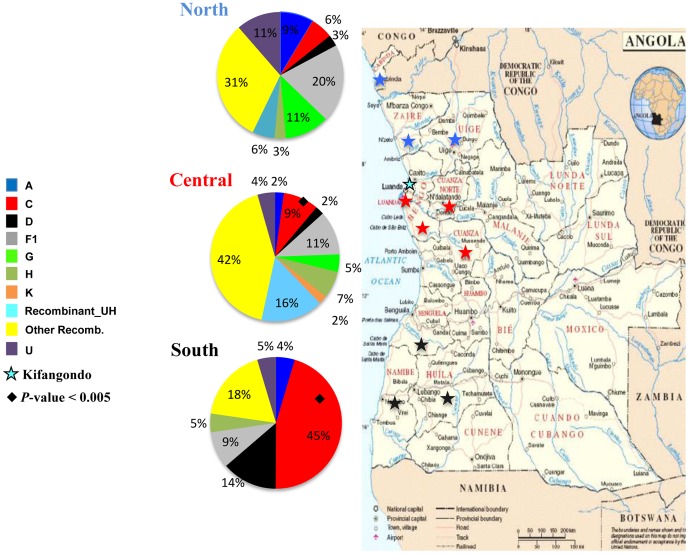
Figure 5. Map of Angola showing the frequency of HIV-1 genetic variants across different country regions (Central, North and South).
Provinces where patients included in the present study were from are indicated: Luanda, Bengo, Cuanza Norte and Cuanza Sul provinces of the Central region (red stars); Cabinda, Zaire and Uíge provinces of the North region (blue stars); and Benguela, Huíla and Namíbe provinces of the South region (black stars). Kifangondo is indicated with a black and blue star. Statistically significant difference in HIV-1 clade distribution was observed in subtype C prevalence between North vs South (p = 0.0005) and Central vs South (p = 0.0012) regions.

