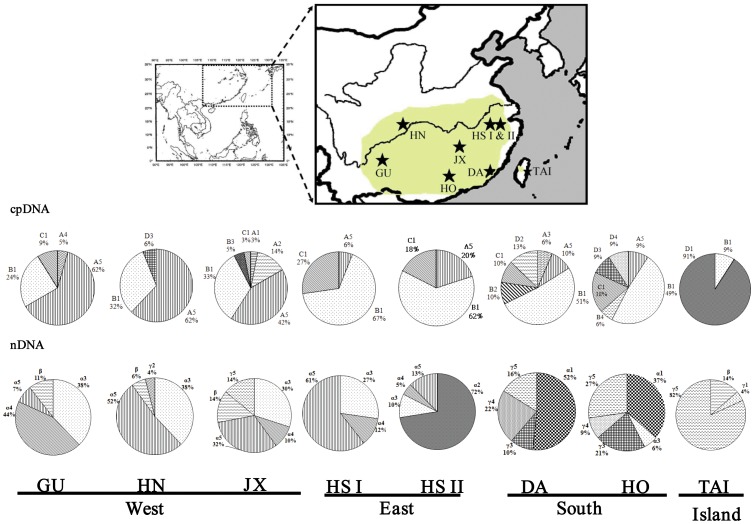
Figure 1. Map showing the distribution and genetic composition of populations of Pinus massoniana in mainland China and Taiwan (Pale-green region: species range).
Frequencies of cpDNA and nDNA haplotypes in each population are indicated by pie diagrams. Abbreviations of populations are given in Table 1.

