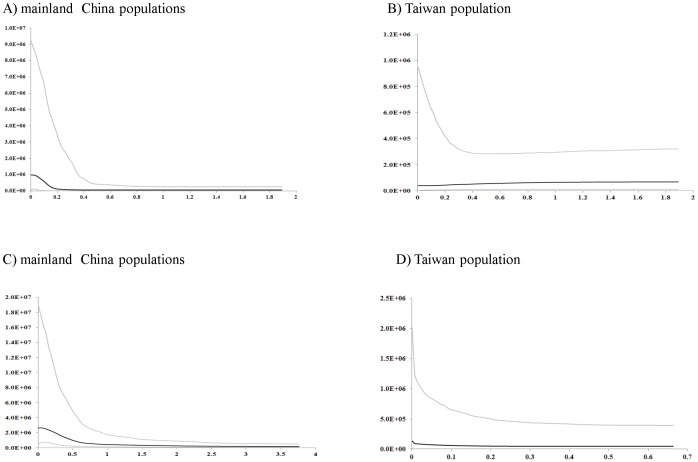
Figure 6. Bayesian skyline plots based on cpDNA and nDNA for the effective population size fluctuation through time.
Y axis: population size × generation time; X axis: time, years before present (million years ago). Population fluctuations of A) mainland populations based on cpDNA; B) Taiwan population based on cpDNA; C) mainland populations based on nDNA; and D) Taiwan population based on nDNA are presented. Black lines represent median estimations; area between gray lines represent 95% confidence intervals).

