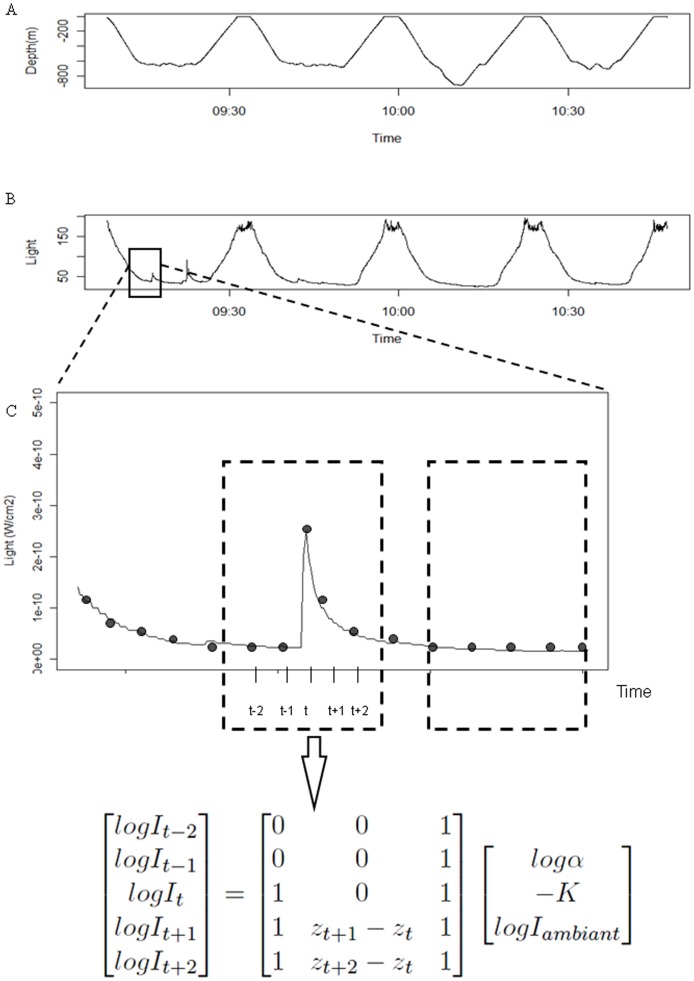
Figure 1. Detection of bioluminescence events.
A. An individual time-depth profile zoomed on four consecutive dives. B. Light values associated with dives. C. The method used to detect bioluminescence events. Each point is associated to a light value (I), a depth value (Z) and a time (t). A restricted window (dashed lines) was moved point by point along the light profile. Within a window, the central point corresponded to the I(t) light value. Iambient corresponded to the expected light level when there is no bioluminescence event and was calculated using the two first light values within the window. α(t) corresponded to the ratio between the Iambient and the I(t) light values. The Kt corresponded to the coefficient associated with the decrease of the light following an event.

