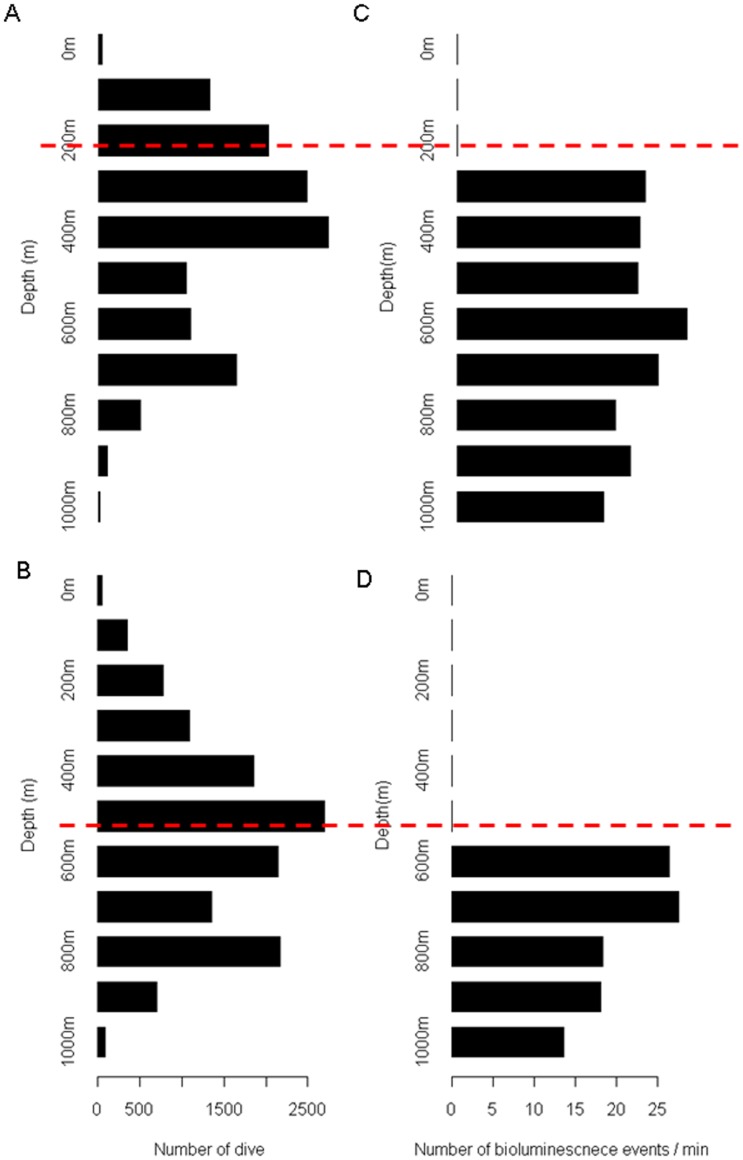
Figure 6. Dive depth and the depth of bioluminescence events.
A–B. Histogram of the dives depth at night (A) and during the day (B). C–D. Histogram of the depth of bioluminescence event per minute at night (C) and during the day (D). Events were only detected at night below a threshold of 250 m and during the day below a threshold of 500 m (shown by a dashed red line).

