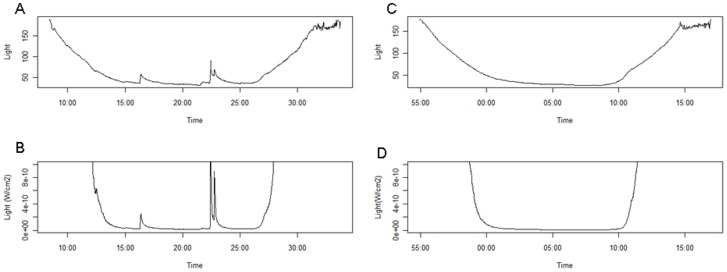
Figure 7. Bioluminescence and foraging intensity.
A–B. A light profile (raw values = A; W/cm2 = B) for a dive with many bioluminescence events and a high foraging index, controlling for depth and bottom time. C–D. A light profile (raw values = C; W/cm2 = D) for a dive without bioluminescence events and a low foraging index, controlling for depth and bottom time.

