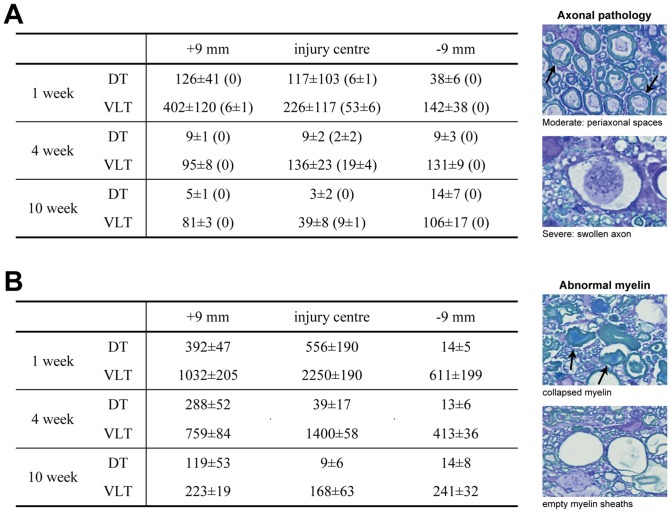
Figure 7.
A) Number of axons with moderate pathology at 1-, 4- and 10-weeks after SCI in dorsal tracts (DT) and ventrolateral tracts (VLT). Numbers in brackets are axons exhibiting severe pathology. Note: These numbers should not be regarded as absolute numbers but rather as indicative of relative differences (see Methods). Examples of pathology are shown on right. Data are mean ± SEM (n = 3–4 at each time). B) Number of empty/collapsed myelin sheaths (examples shown on right) at 1-, 4- and 10-weeks after SCI in dorsal tracts (DT) and ventrolateral tracts (VLT). Data are mean ± SEM (n = 3–4 at each time).

