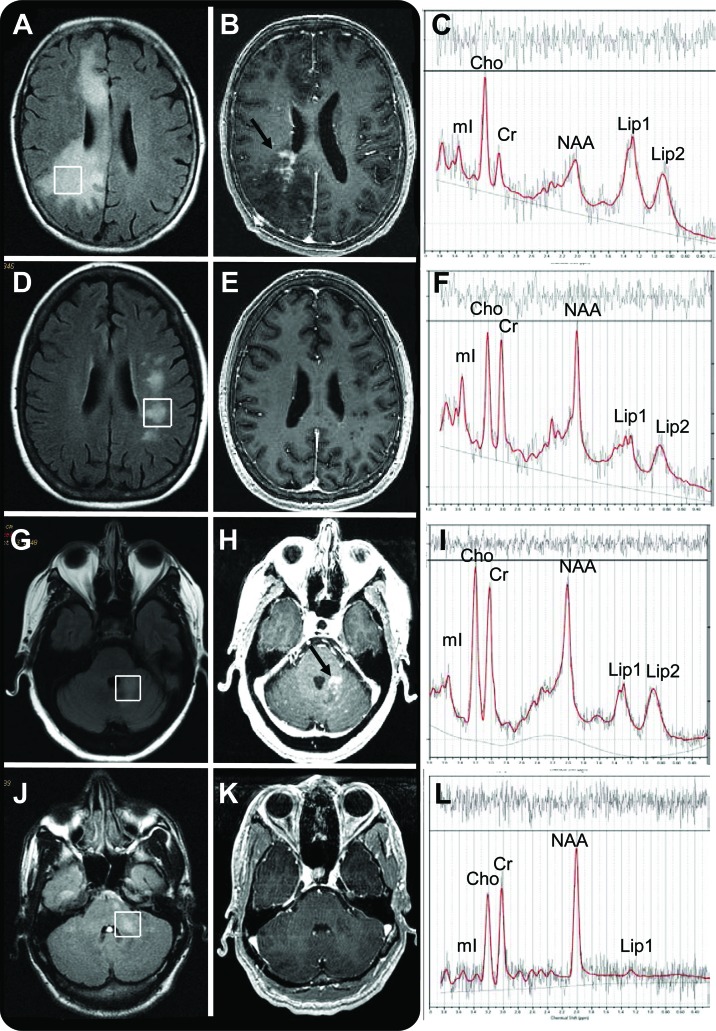
Figure 1. MRI and proton magnetic resonance spectroscopy (1H-MRS) characteristics of progressive multifocal leukoencephalopathy (PML) and PML-immune reconstitution inflammatory syndrome (IRIS) lesions.
(A–F) Cerebral PML lesion of an HIV− patient with PML-IRIS (A–C) and PML without IRIS (D–F) seen on fluid-attenuated inversion recovery (FLAIR) (A, D), and T1-weighted images with gadolinium (B, E). The area of enhancement is marked by an arrow (B), and the 1H-MRS spectrum (C, F) shows elevated choline (Cho) and lipid peaks in the patients with PML-IRIS. (G–L) Cerebellar PML lesion of an HIV− patient with PML-IRIS (G–I) and an HIV+ patient with PML without IRIS (J–L) seen on FLAIR (G, J) and T1-weighted image with gadolinium (H, K). The area of enhancement is marked by an arrow (H), and the 1H-MRS spectrum (I, L) shows elevated Cho and lipid peaks in the patient with IRIS. Cr = creatine; Lip1 = lipid/lactate; Lip2 = lipid/macromolecules; mI = myo-inositol; NAA = N-acetylaspartate.

