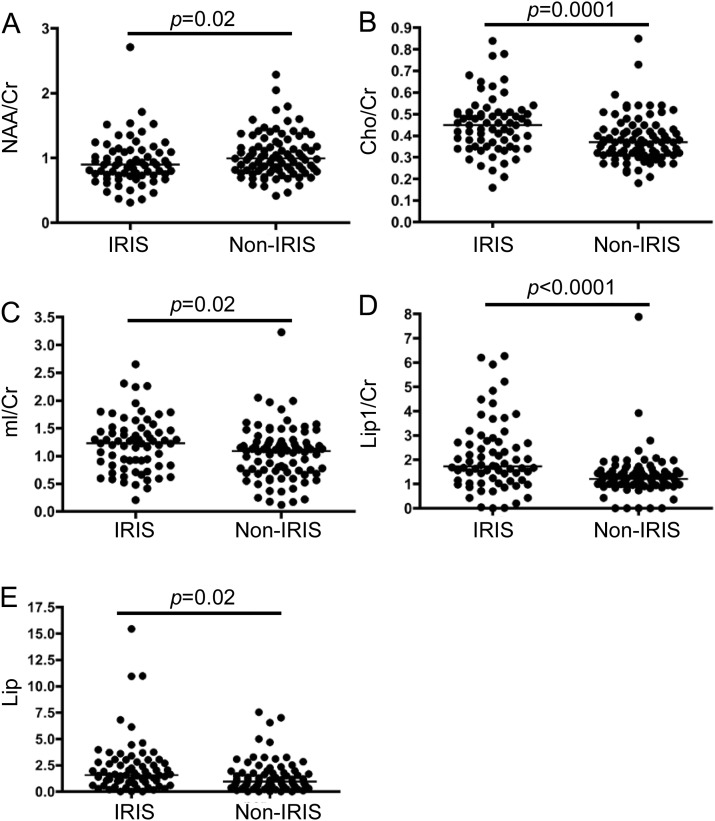
Figure 2. Comparison of metabolite ratios within progressive multifocal leukoencephalopathy (PML) lesions of patients with and without immune reconstitution inflammatory syndrome (IRIS).
All MRIs were obtained within 1 year of onset of PML symptoms. Each dot represents the ratio obtained within one lesion. The bars represent the median ratio: (A) N-acetylaspartate (NAA)/creatine (Cr) ratio; (B) choline (Cho)/Cr ratio; (C) myo-inositol (mI)/Cr ratio; (D) lipid/lactate (Lip1)/Cr ratio and (E) lipid/macromolecules (Lip2)/Cr ratio.

