
Figure 1. Architecture of the cortical network model.
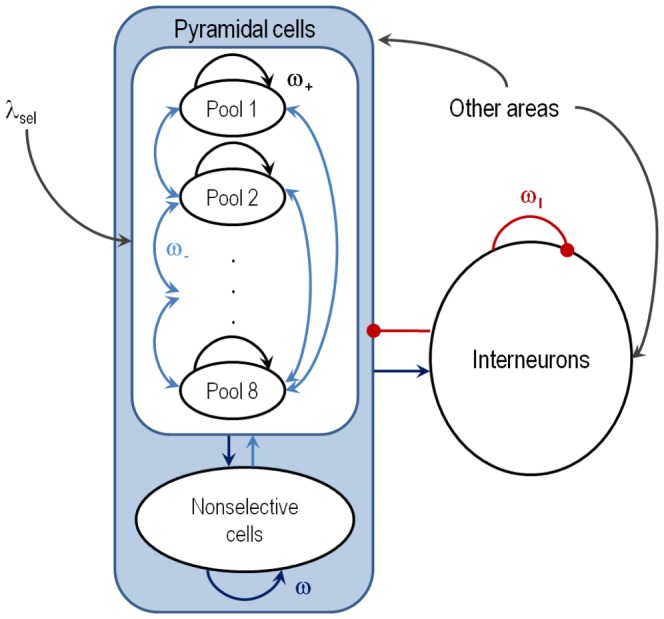
The population of excitatory neurons is subdivided in non-overlapping populations selective to 8 different stimuli. Black and blue arrows within pyramidal cells: NMDA and AMPA-mediated recurrent excitatory connections. Black arrows from other areas: AMPA-mediated external excitatory connections. Red circle-headed arrows: GABA-mediated inhibitory connections. There are three possible synaptic strengths for recurrent excitatory connections: potentiated (by a relative factor  , black arrows), depressed (by a relative factor
  , light blue arrows), and unchanged (baseline level
  , dark blue arrows). The weight
  denotes the strength of inhibitory-to-excitatory and inhibitory-to-inhibitory connections. The dots stand for the missing
  , …,
, …,  populations and their corresponding connections.