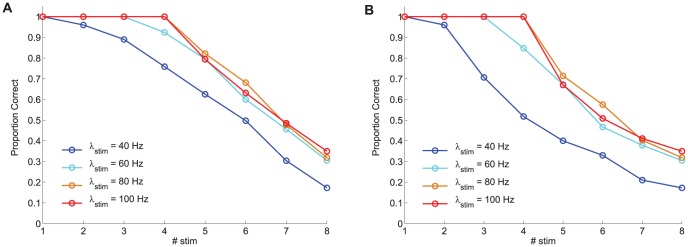
Figure 3. Model-based prediction of performance for different levels of external stimulation.
Model-based prediction of performance derived from computational simulations of a change detection task with  selective neural assemblies (
 axis) simultaneously stimulated. Performance is calculated by assuming that an item is held in visual WM when its associated selective pool shows a mean persistent activity
  20 Hz during the last 300 ms of the delay period.
  selective pools are stimulated at different amplitude levels
  = 40 Hz, 60 Hz, 80 Hz, and 100 Hz. A Performance calculated as
  (Eq. 7), and B performance calculated as
  (Eq. 8). For both proposed performance estimates, performance decreases for larger set sizes but improves for larger stimulation amplitudes up to a value (
 =
=  80 Hz) beyond which performance seems to converge.

