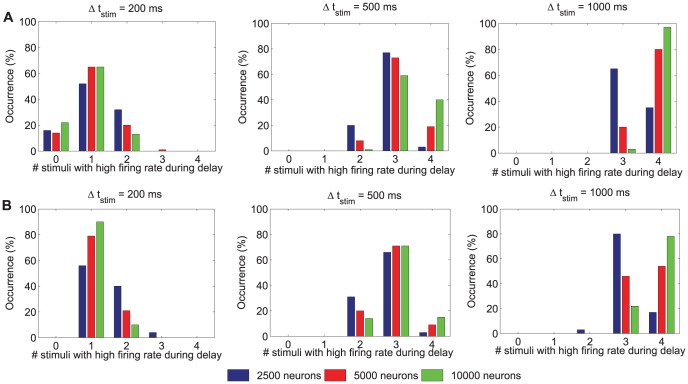
Figure 7. Distribution of number of items maintained in WM as a function of network size.
Histograms illustrating the percentage of trials in which multiple items show high activity during the last 300 ms of the delay period for different stimulation periods:  = 200 ms, 500 ms and 1000 ms and different network sizes
  = 2500, 5000 and 10000 neurons. A Four pools receive an additional external stimulation
  = 60 Hz, and B the pool selective to the salient item receives an external stimulation
  = 100 Hz while the remaining three stimulated pools receive only
  = 60 Hz. The network parameters employed in these simulations are those shown in Table 1. The results illustrate that eWMC increases when the stimulation period is increased for intermediate (500 ms) and long (1000 ms) stimulation periods, and is reduced in the presence of saliency. This tendency is stronger for larger network sizes as a consequence of the reduced finite size noise. For short stimulation periods (200 ms), the competition processes in the saliency condition favours a winner-take-all type of behaviour for the salient item.

