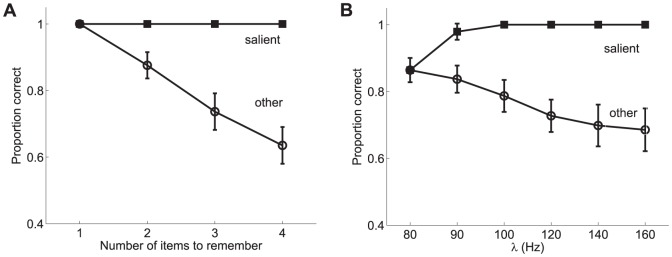
Figure 13. Model prediction of saliency influence on proportion correct in a visual WM task.
A Performance predicted by the model in a change detection task akin to the experiments in [19] (also see Fig. 11) as a function of set size. The pool selective to the salient stimulus receives an external stimulation  = 120 Hz whereas the pools that are not selective to the salient stimulus but are stimulated receive an external stimulation
  = 80 Hz during the 200 ms stimulation period. B Performance predicted by the model in a change detection task akin to the experiments in [19] (also see Fig. 12) as a function of the saliency level. In the model, visual saliency is introduced by means of an upregulation of the neuronal responses to the item. To this end, different levels of additional external stimulation are considered:
  = 80, 90, 100, 120, 140 and 160 Hz for set size 3. In both cases, the results are assessed separately for the trials in which the target item corresponds to the salient item and those which do not coincide with the salient item (i.e. other). The network parameters employed in these simulations are those shown in Table 1. The results suggest a good qualitative conformance with the experimental results shown in Fig. 11 and Fig. 12. It is worth noting that no specific tuning of the network parameters has been sought to reproduce such results. The same parameters used in the previous studies, which reproduce the main results from the available literature, have also been used in this case.

