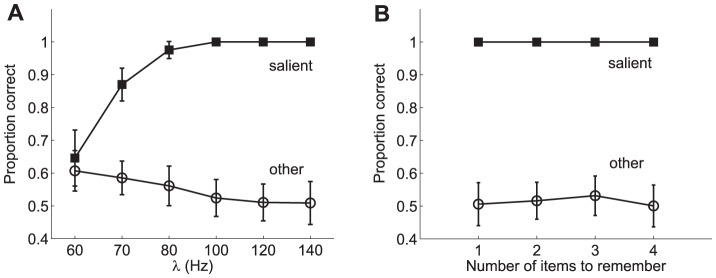
Figure 15. Performance dependence on stimulation amplitude at baseline level.
The stimulation amplitude at baseline level  is a limiting factor of eWMC. Not only a sufficiently large
  value is necessary to reach the full WM capacity of the network but also the absolute difference between
  and
and  has different effects depending on the baseline level
  . A Performance predicted by the model in a change detection task akin to the experiments in [19] as a function of the saliency level. In the model, visual saliency is introduced by means of an upregulation of the neuronal responses to the item. To this end, different levels of additional external stimulation are considered:
  = 60, 70, 80, 100, 120 and 140 Hz for set size 3. B Performance predicted by the model in a change detection task akin to the experiments in [19] as a function of set size. The pool selective to the salient stimulus receives an external stimulation
  = 100 Hz whereas the pools that are not selective to the salient stimulus but are stimulated receive an external stimulation
  = 60 Hz during the 200 ms stimulation period. This corresponds, in fact, to a particular working point of the graph in A for a varying set size. In this case, the salient item is always maintained in working memory throughout the delay period but random performance is obtained for non-salient items, thus suggesting a winner salient item in a winner-take-all network. In both plots, the results are assessed separately for the trials in which the target item corresponds to the salient item and those which do not coincide with the salient item (i.e. other). The network parameters employed in these simulations are those shown in Table 1.

