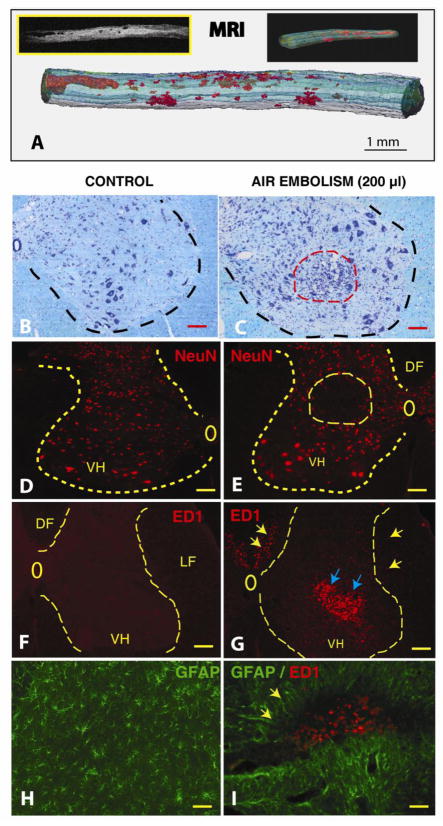
Figure 5. Development of spinal neurodegenerative changes after spinal air embolism.
Animals received 200 μl of intra-aortic air injection and survived for 3 weeks. Neurologically, animals developed spastic paraplegia at 4–5 days after air embolism and spasticity persisted for the whole period of 3 weeks survival.
A: After perfusion fixation with 4% paraformaldehyde, the spinal cord was dissected and imaged in situ with 7T-MRI. Low density necrotic foci (BW insert) were readily identified in both the white and gray matter from the mid-thoracic to lumbosacral spinal segments. 3D reconstruction of stack of calibrated MRI images showed the size of necrotic foci between 200 μm to 2–3 mm (red structures). (Scale bar: 1 mm)
B, C: Kl ver-Barrera staining of transverse spinal cord sections taken from upper lumbar region from a control animal (B) or from an animal after air embolism (C). A clear loss of small interneurons and hypercellularity (likely of microglial origin) in the affected region (C: red dashed circle) can be seen. (Scale bars in B, C: 100 μm)
D, E: Immunofluorescence staining with NeuN antibody in a control animal (D) or from an animal after air embolism (E). Compared to control animals, areas of neuronal loss can be identified in animals after spinal air embolism (E: yellow circle). (Scale bars in D, E: 150 μm)
F, G: Immunofluorescence staining with ED1 antibody in a control animal (F) or from an animal with air embolism (G). Compared to control sections which show no ED1+ cellular elements, a clear accumulation of ED+ cells (activated microglia and macrophages) can be identified in the areas of neuronal loss (blue arrows) as well as in the region of the corticospinal tract in the dorsal funiculus (DF) and in lateral funiculus (LF) (yellow arrows). (Scale bars in F, G: 150 μm)
H, I: Double immunofluorescence staining with ED1 and GFAP antibody in a control animal (H) or from an animal after air embolism (I). Compared to control animals, the presence of hypertrophic GFAP+ astrocytes surrounding the ED1 cell-infiltrated regions can be seen. (Scale bars in H, I: 40 μm)

